Beverly Barnett
San Francisco house and condo market report, Spring 2025 update by Realtor district and neighborhood.

San Francisco Neighborhood Report

  • May 16, 2025

San Francisco HOUSE Market
San Francisco neighborhood housing market report cover with a Golden Gate Bridge panorama.

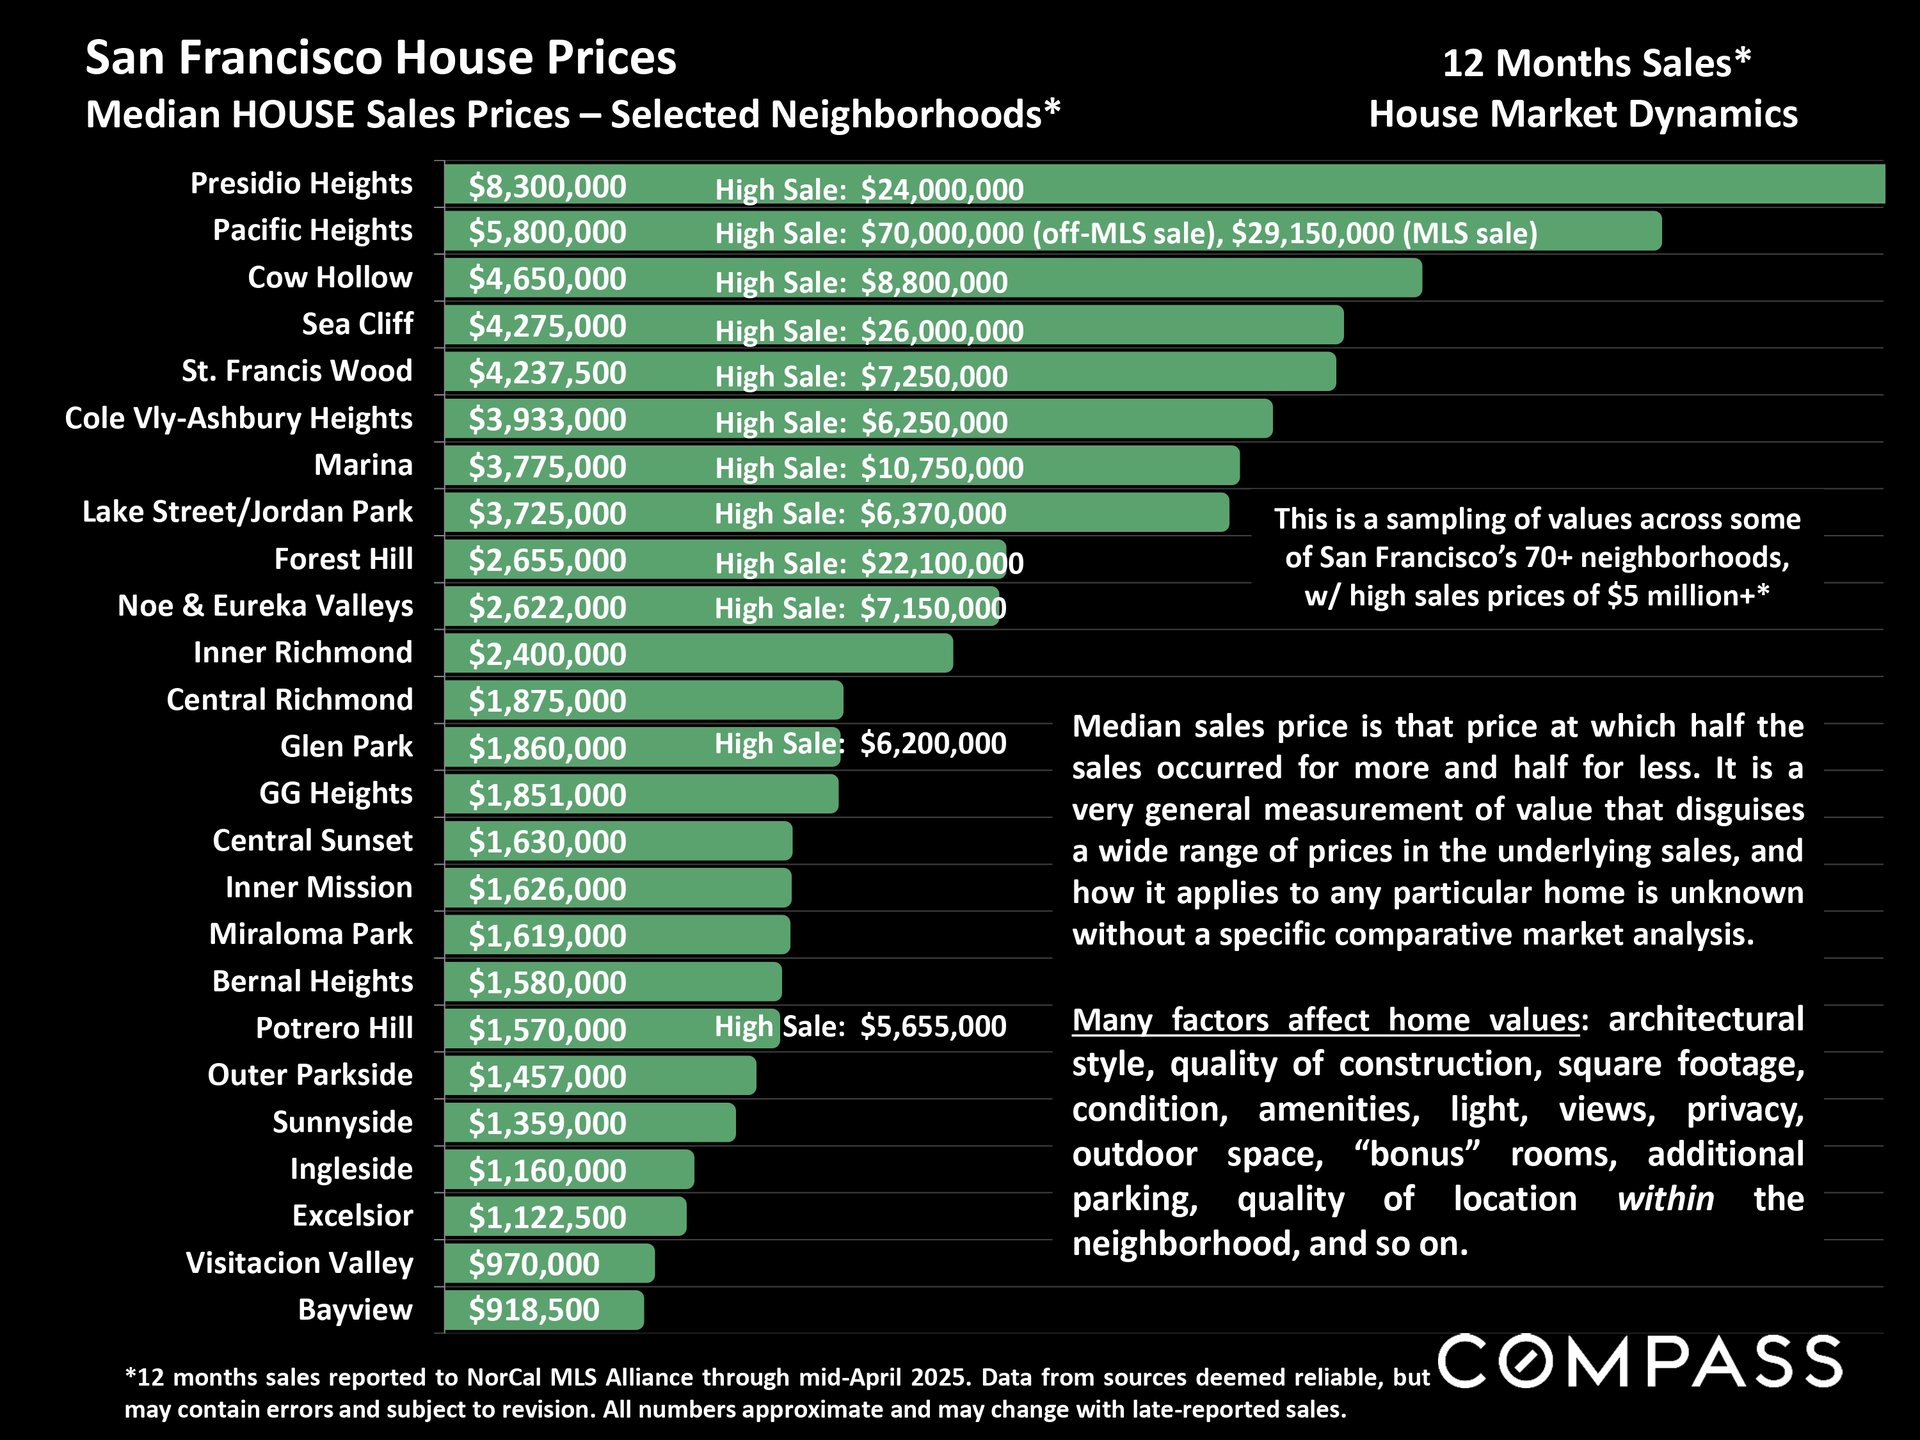
Chart comparing median house prices across selected San Francisco neighborhoods, from Presidio Heights to Bayview.

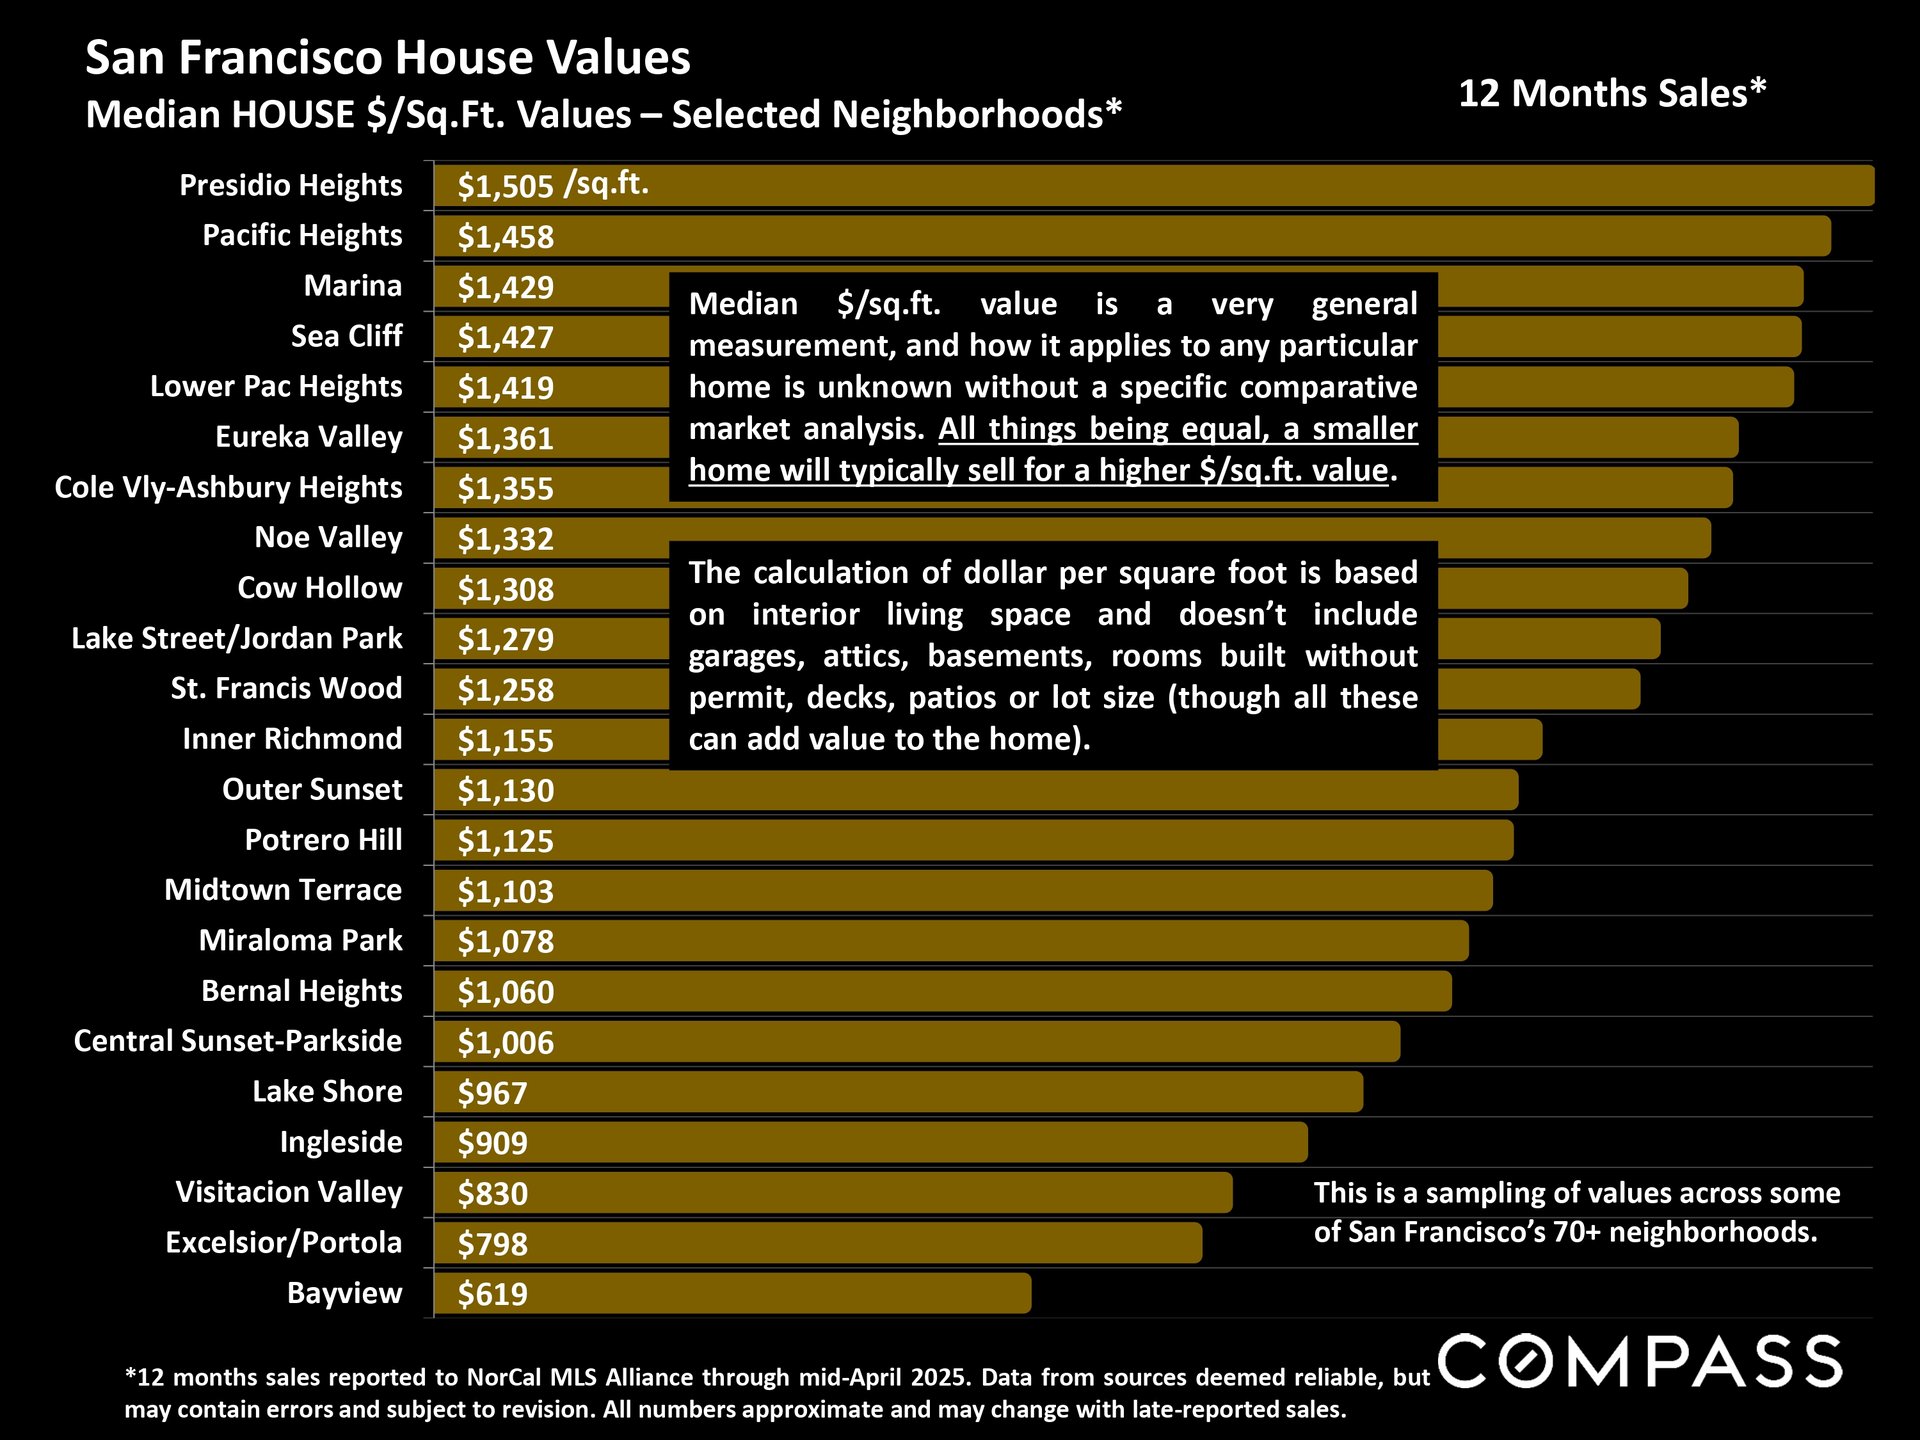
Chart of median house values per square foot across selected San Francisco neighborhoods, from Bayview to Presidio Heights.

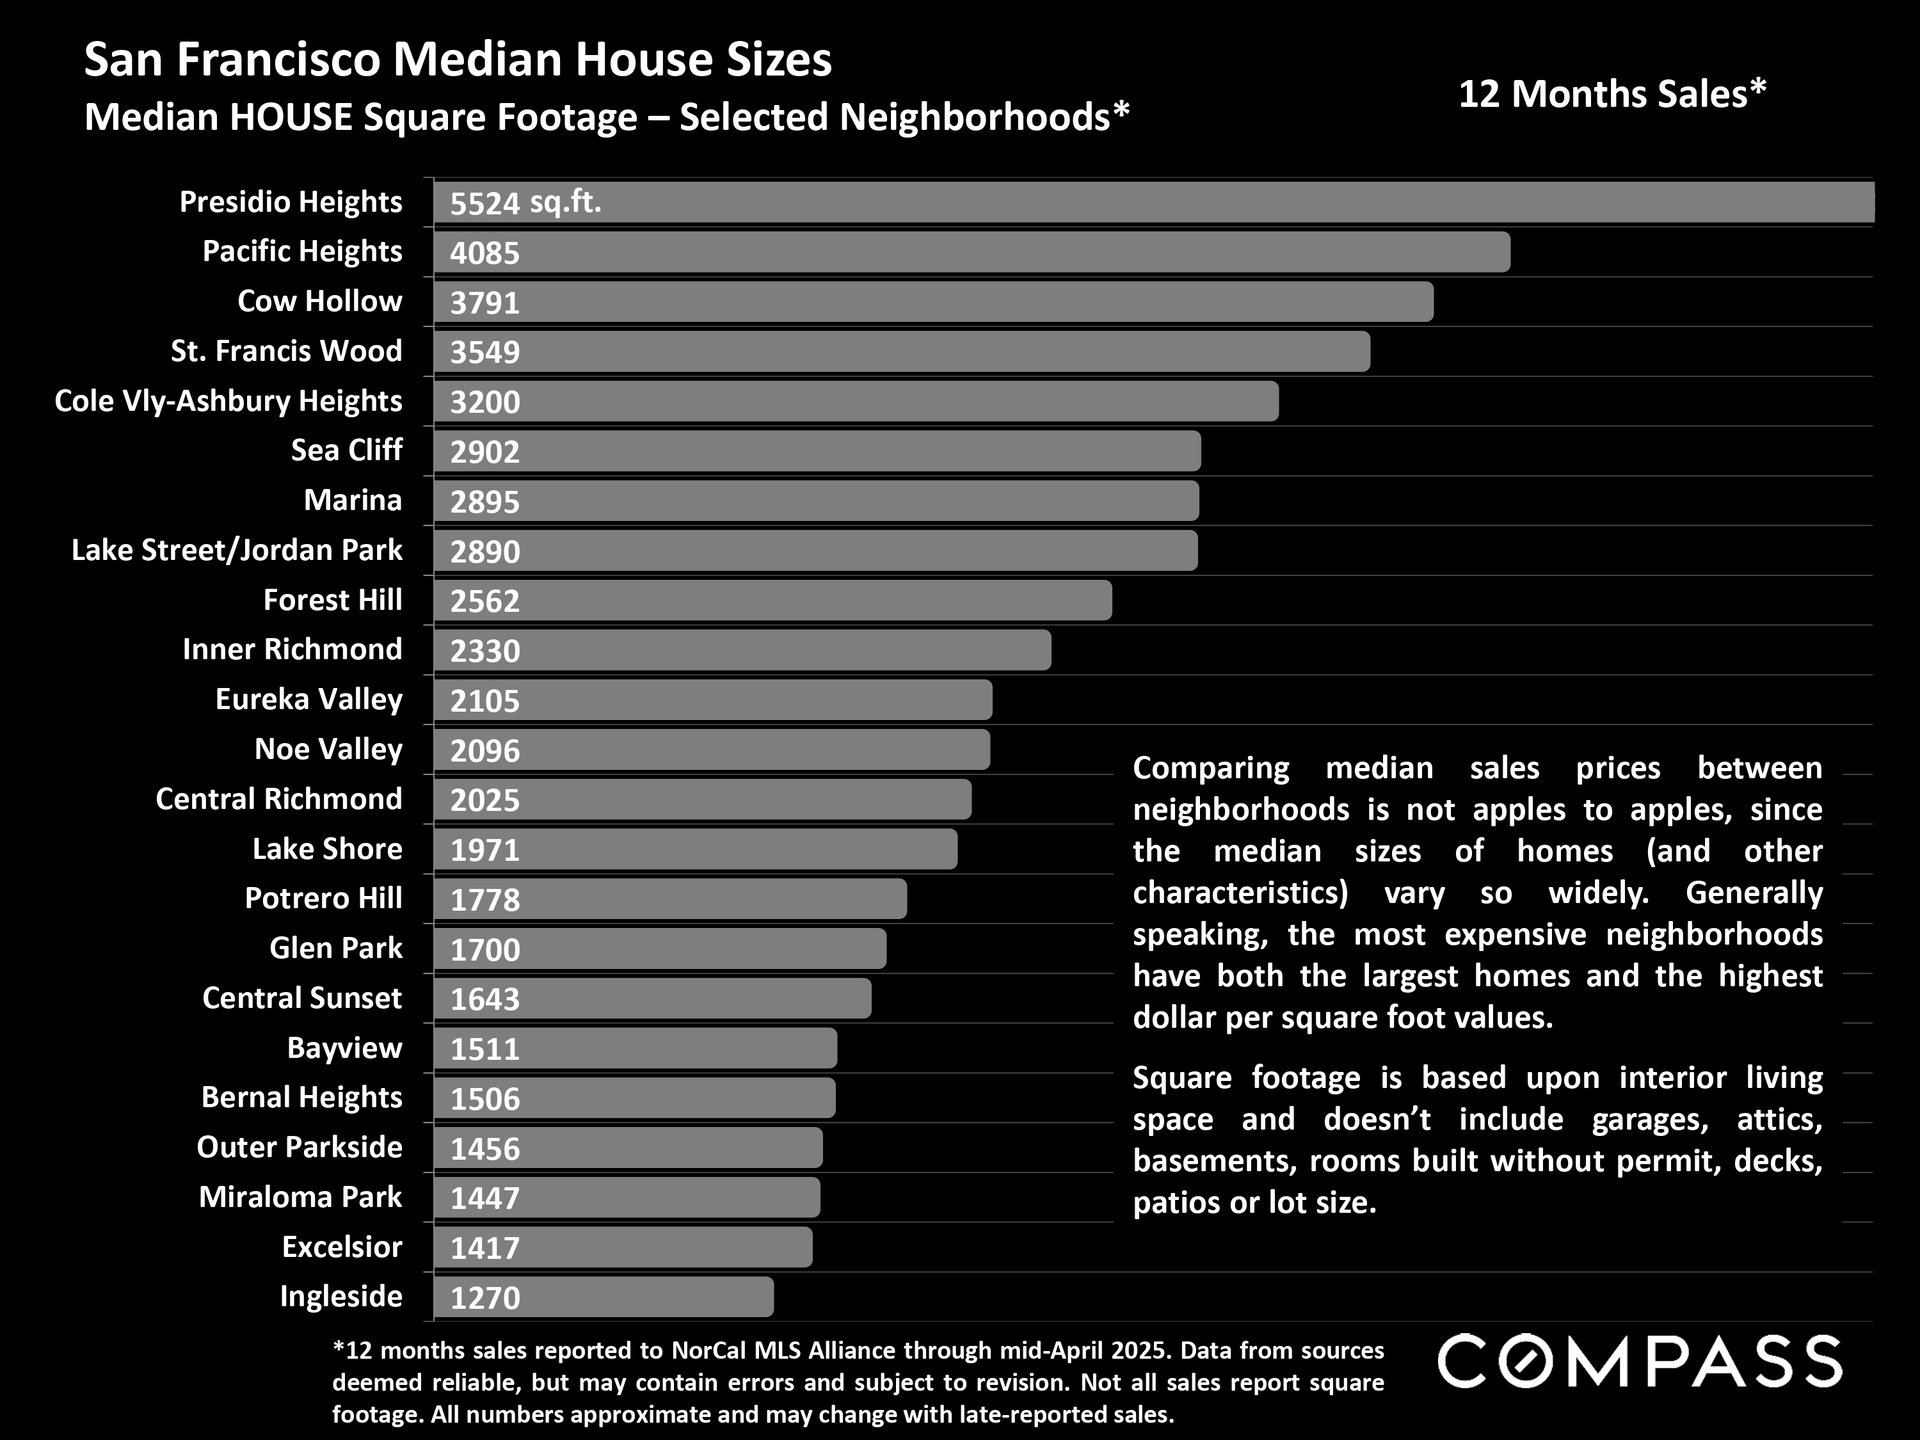
Chart comparing median house sizes across San Francisco neighborhoods, from Presidio Heights at 5,524 square feet to Ingleside at 1,270.

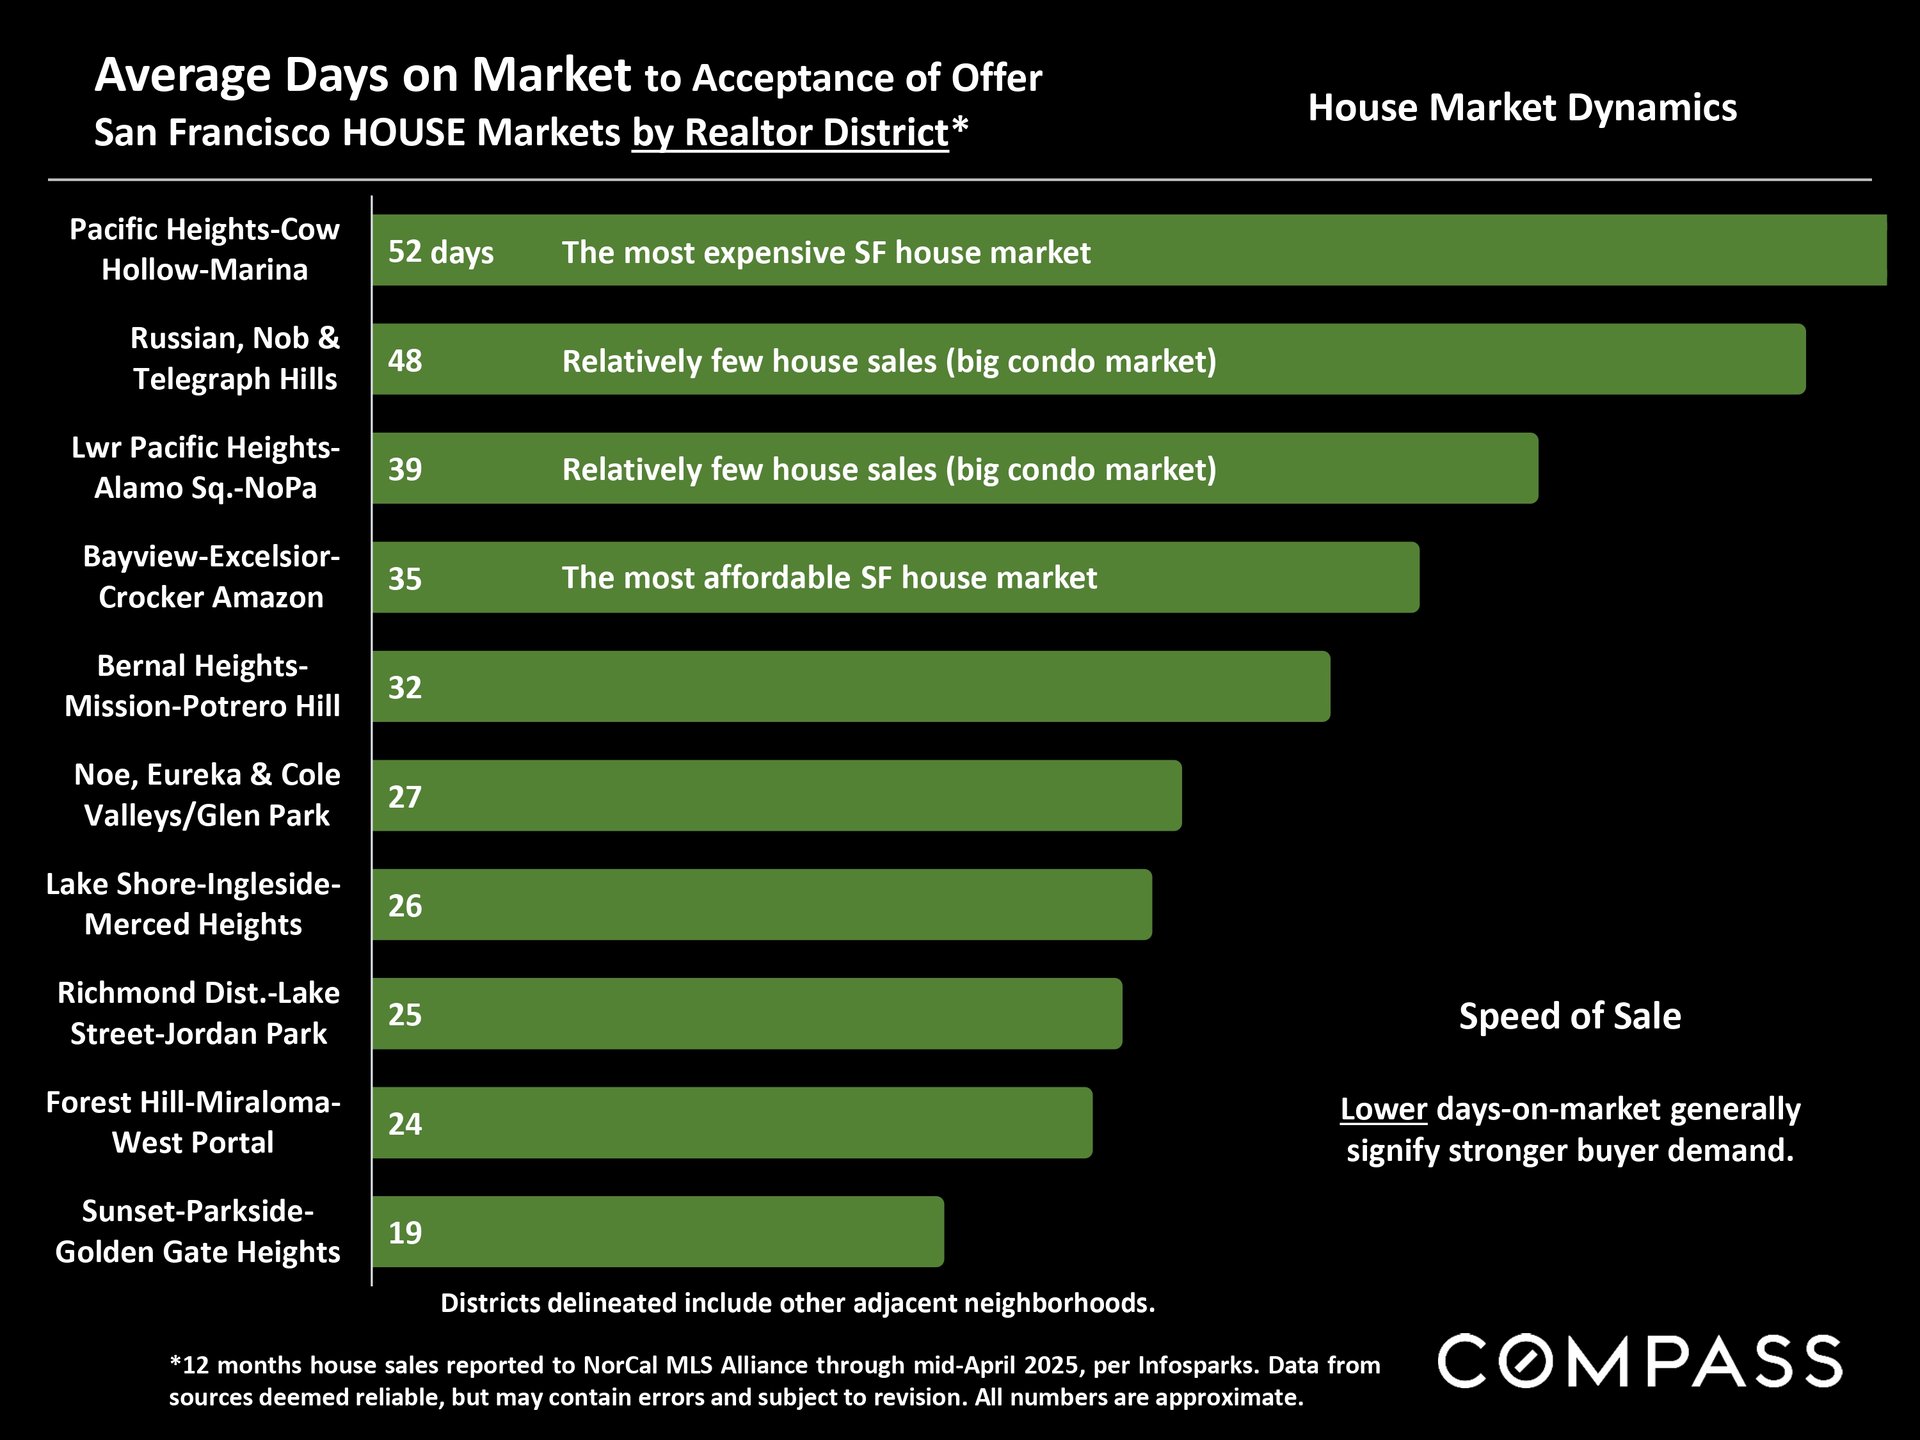
Chart compares San Francisco house-market days on market by district, ranging from 19 days in Sunset-Parkside to 52 in Pacific Heights.

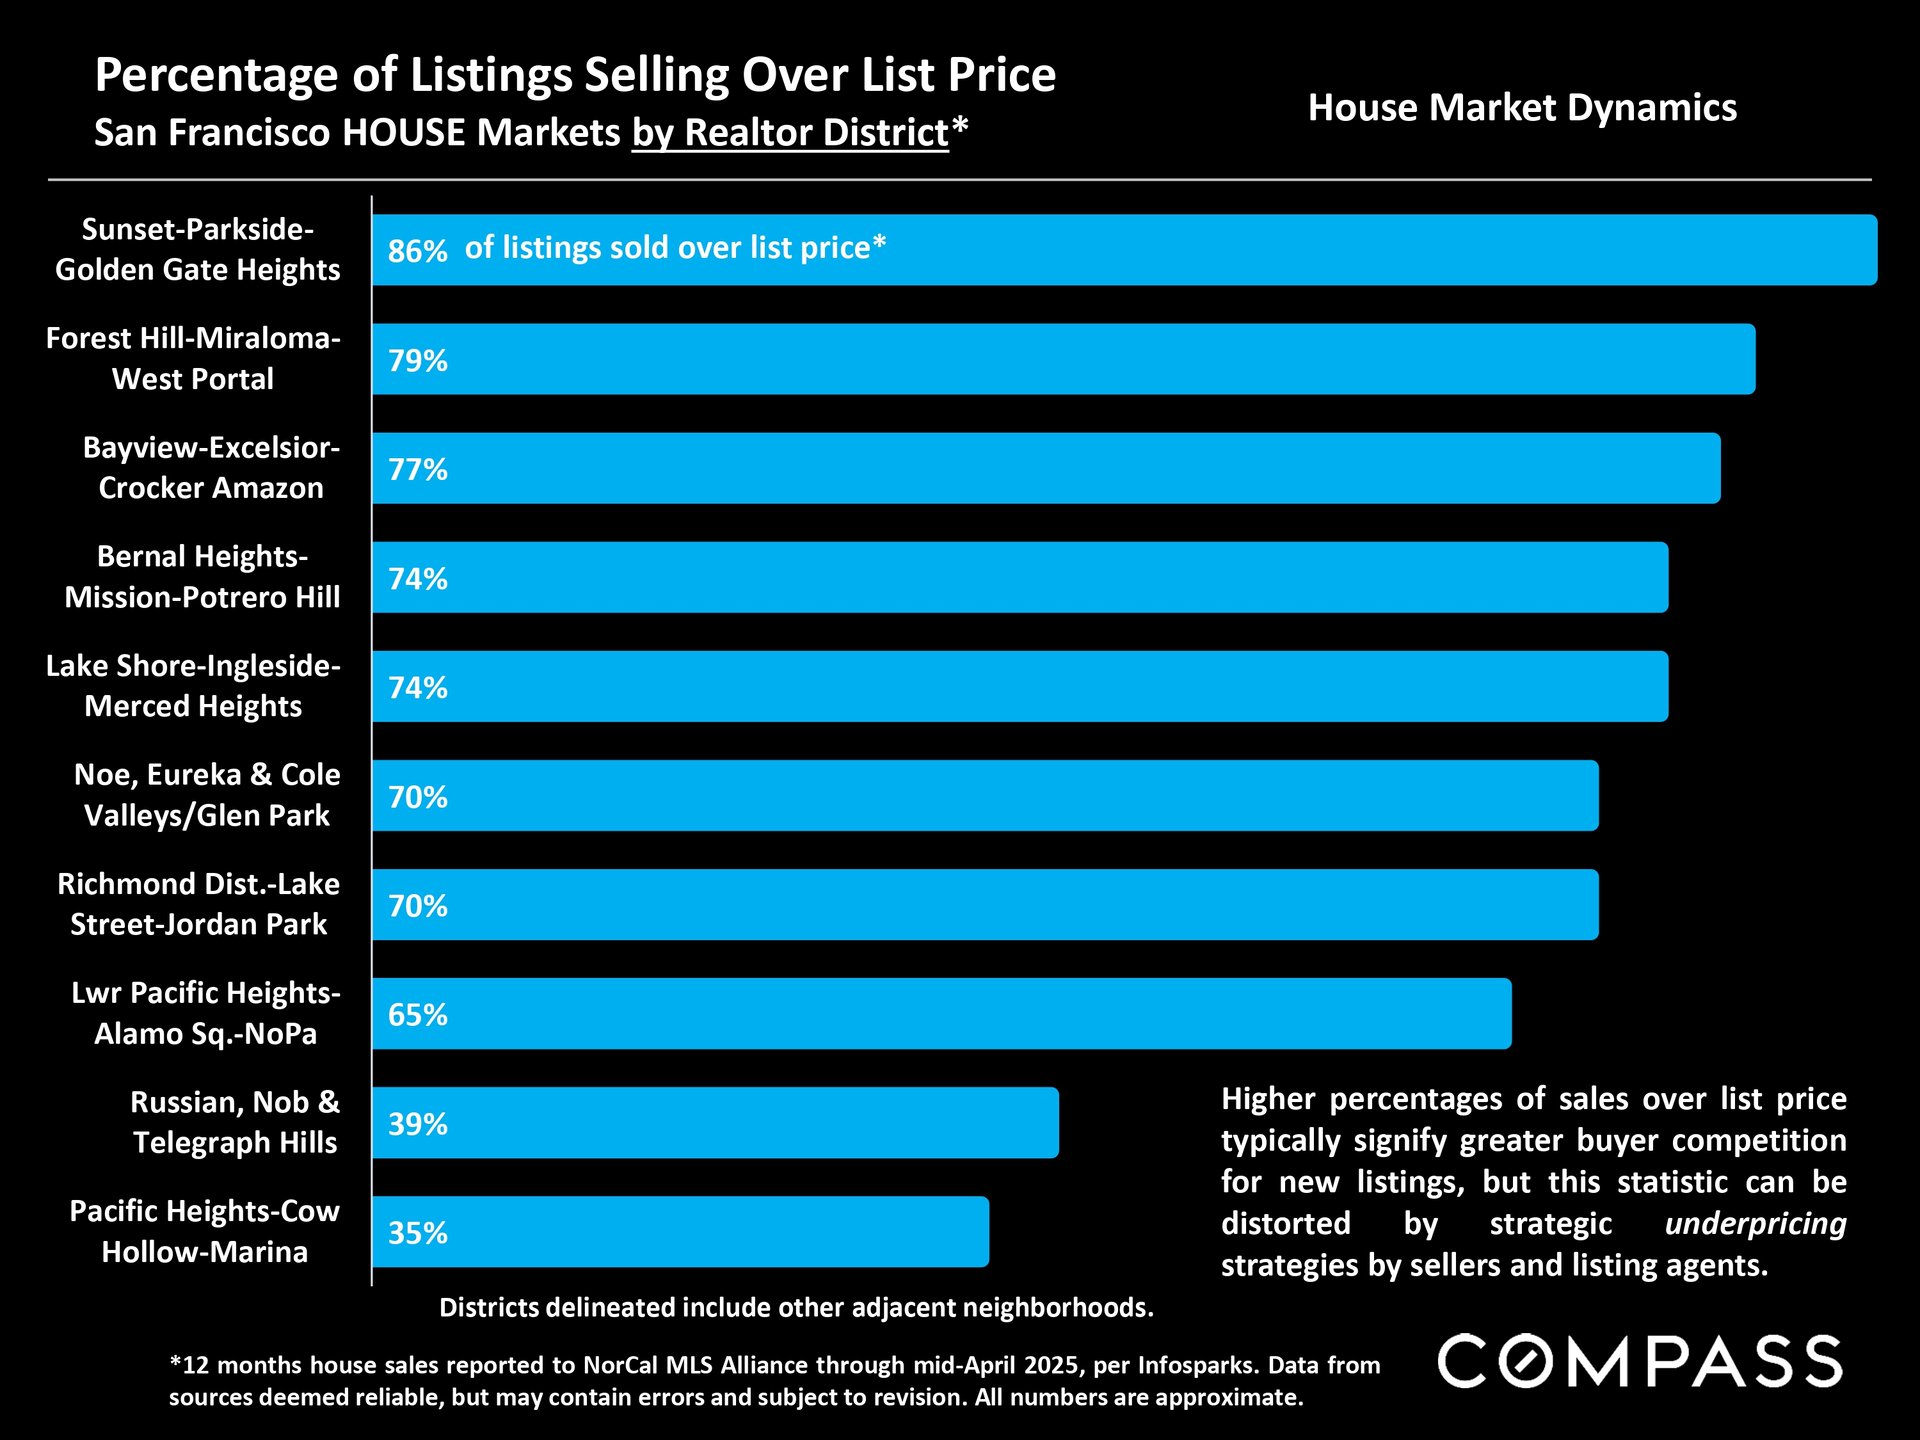
Chart of San Francisco house listings sold over asking price by district, ranging from 35% to 86%.

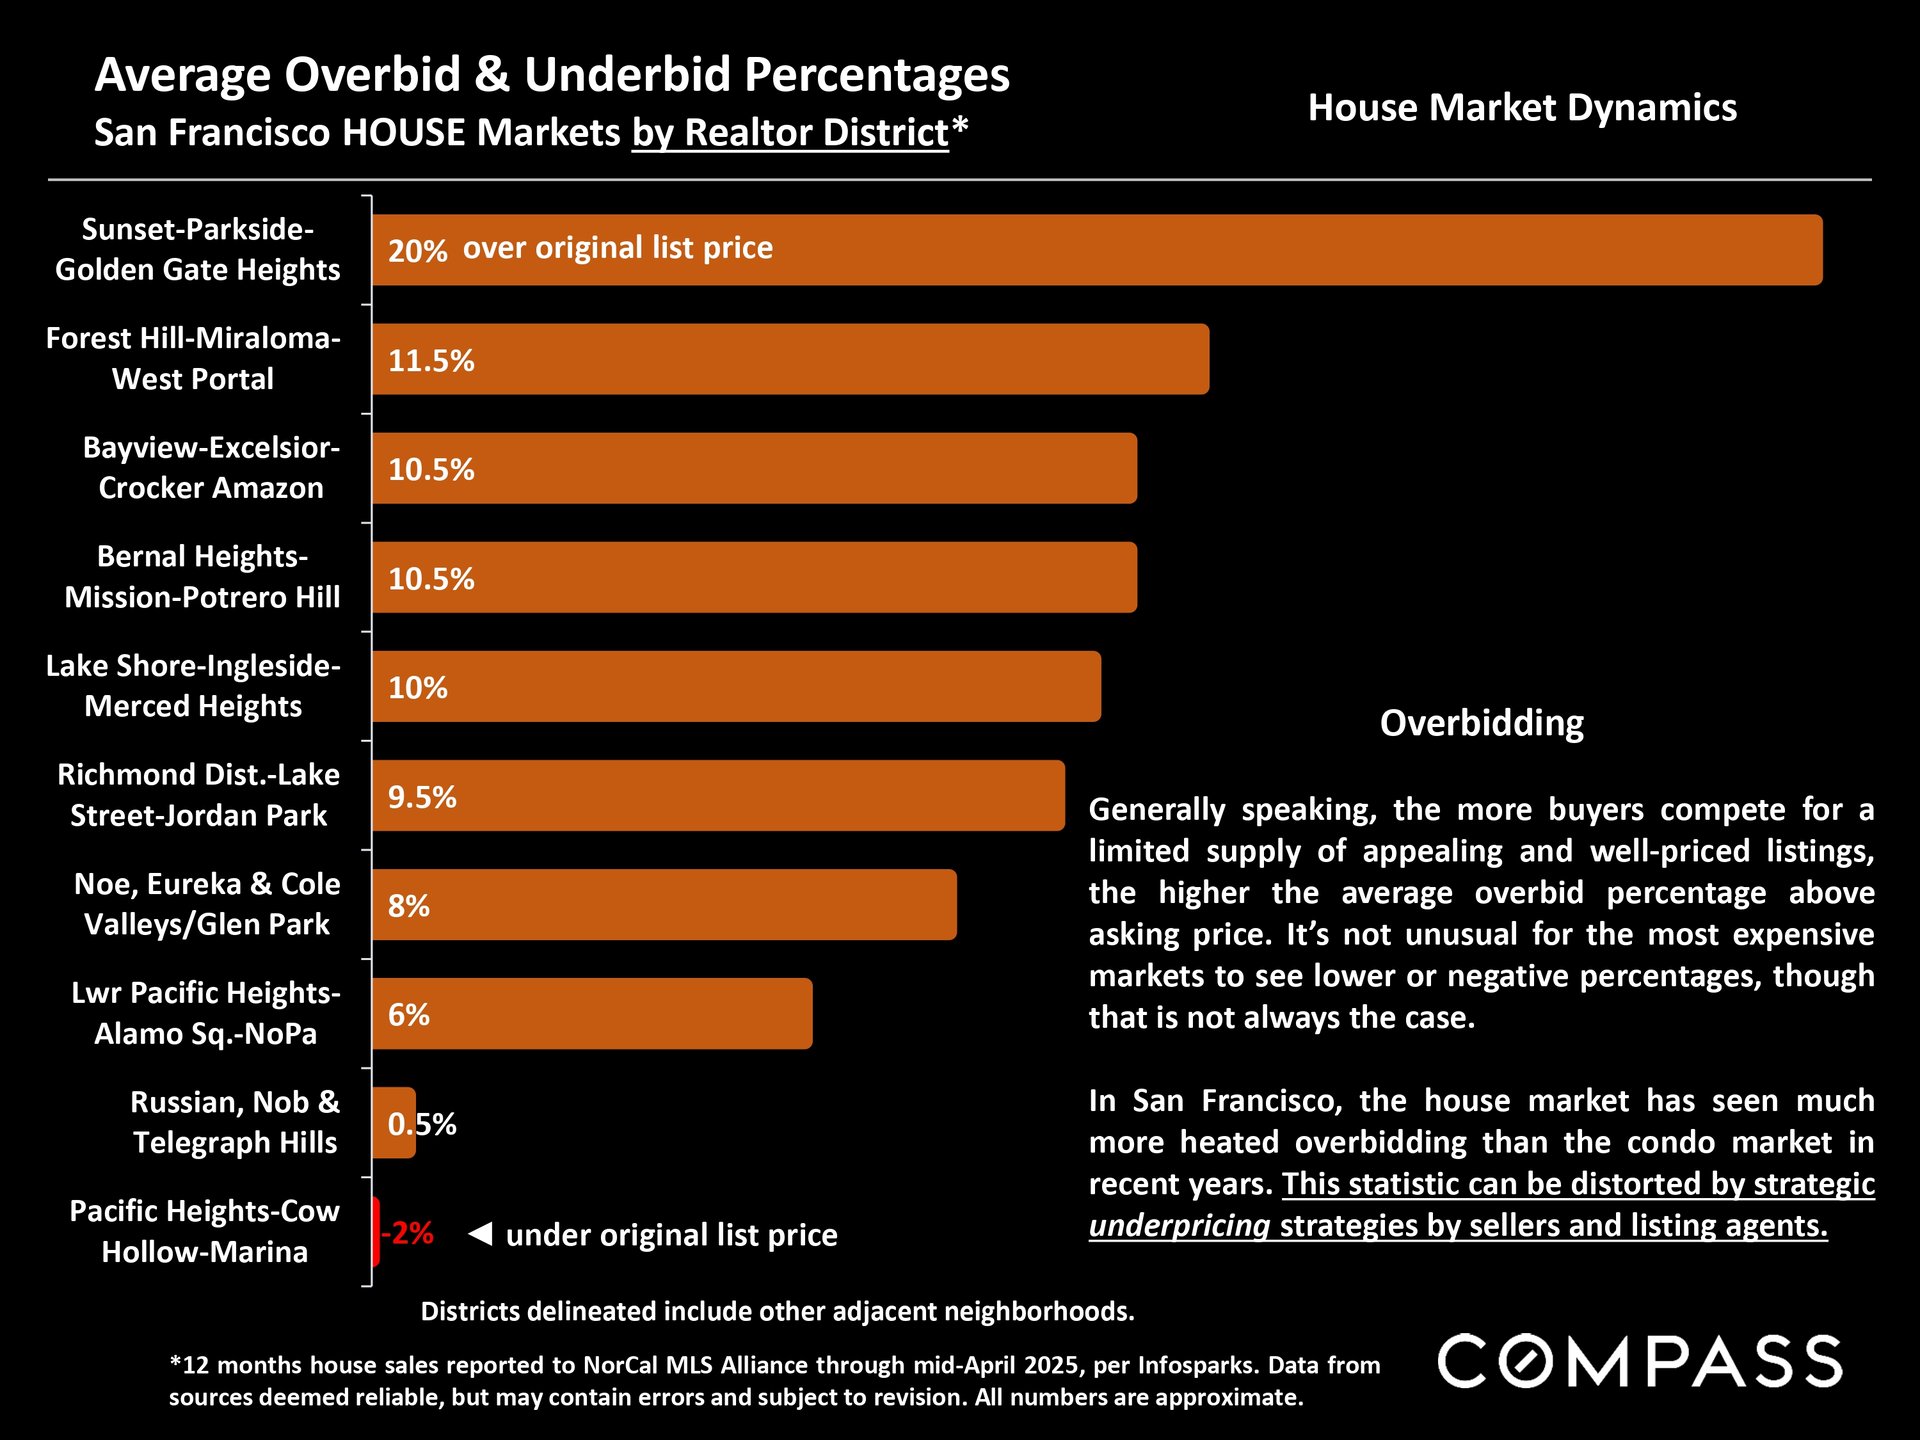
Chart comparing San Francisco house overbid percentages by district, from 20% above asking in Sunset-Parkside to 2% below in Pacific Heights.

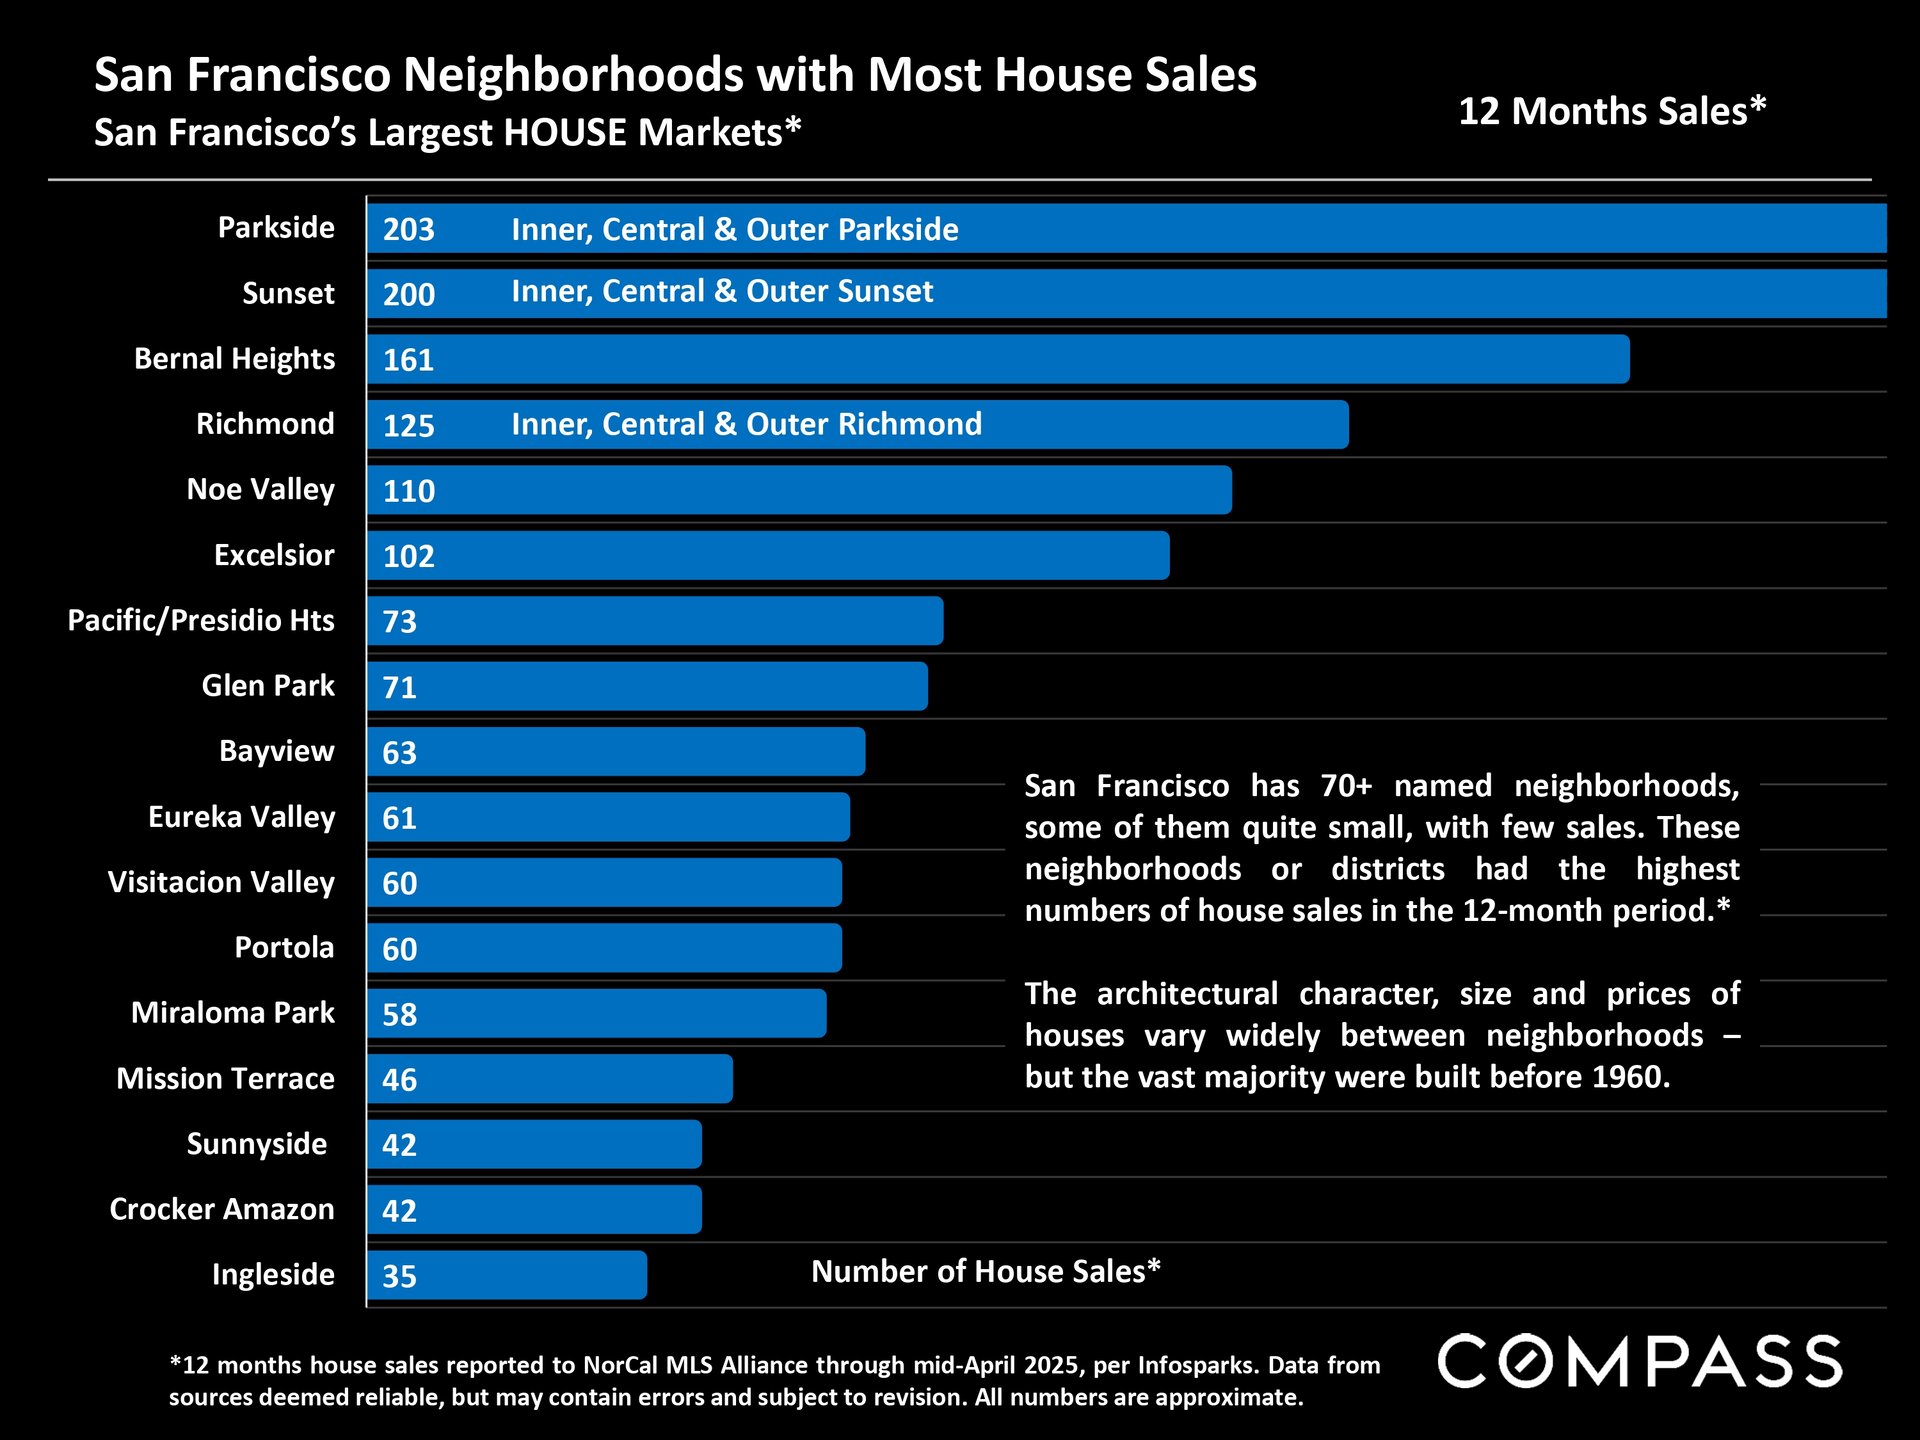
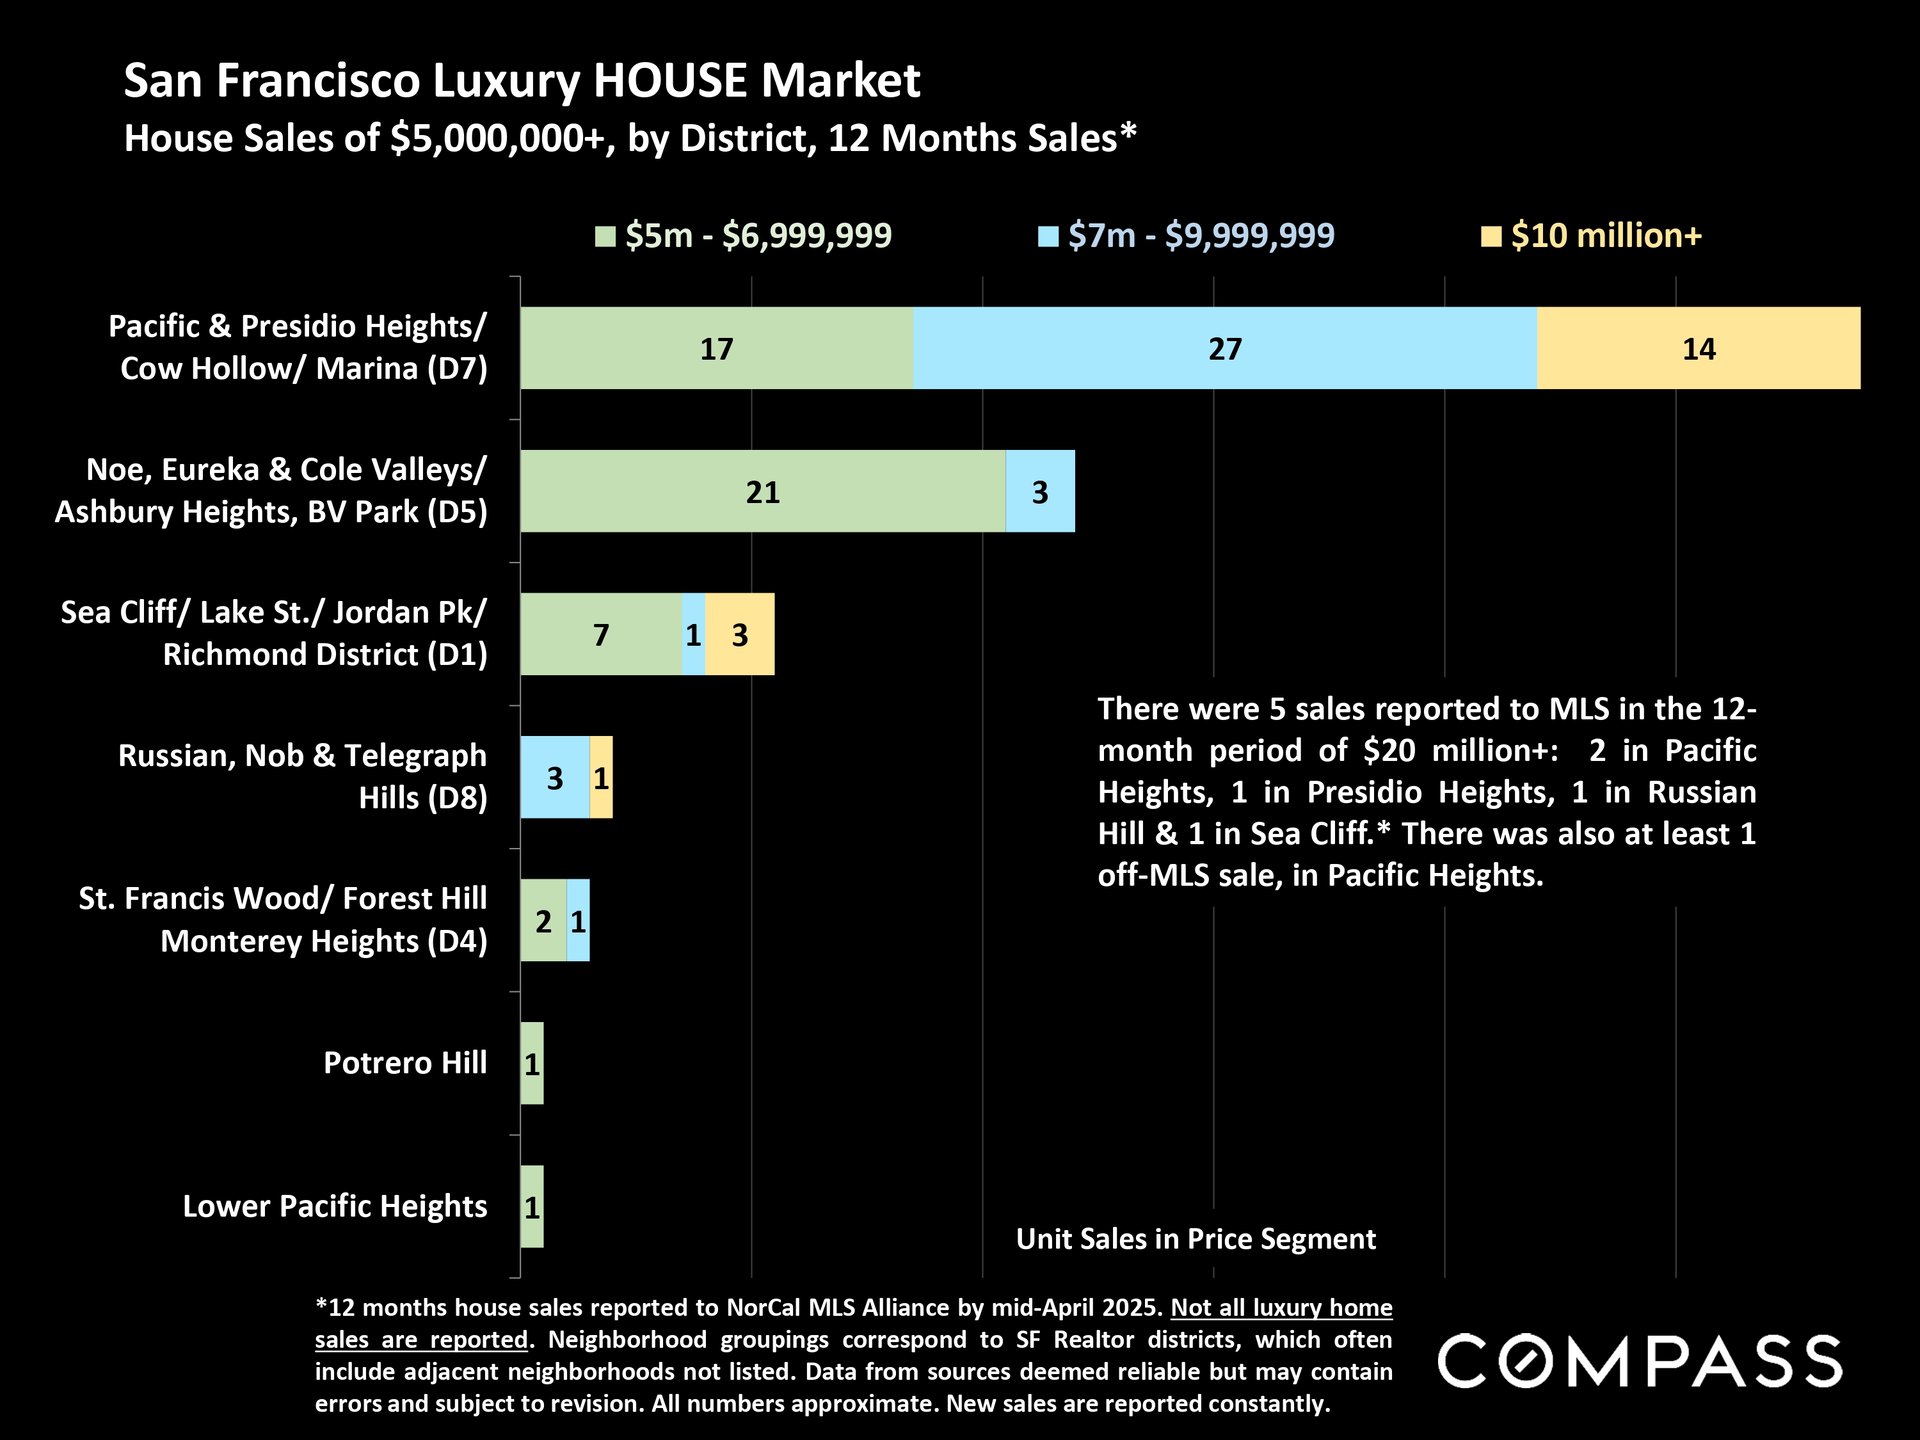
Bar chart ranking San Francisco neighborhoods by 12-month house sales; Parkside leads with 203, followed by Sunset with 200.Chart of San Francisco luxury house sales by district and price segment, with Pacific Heights, Cow Hollow, and Marina leading.

San Francisco Condo Market 
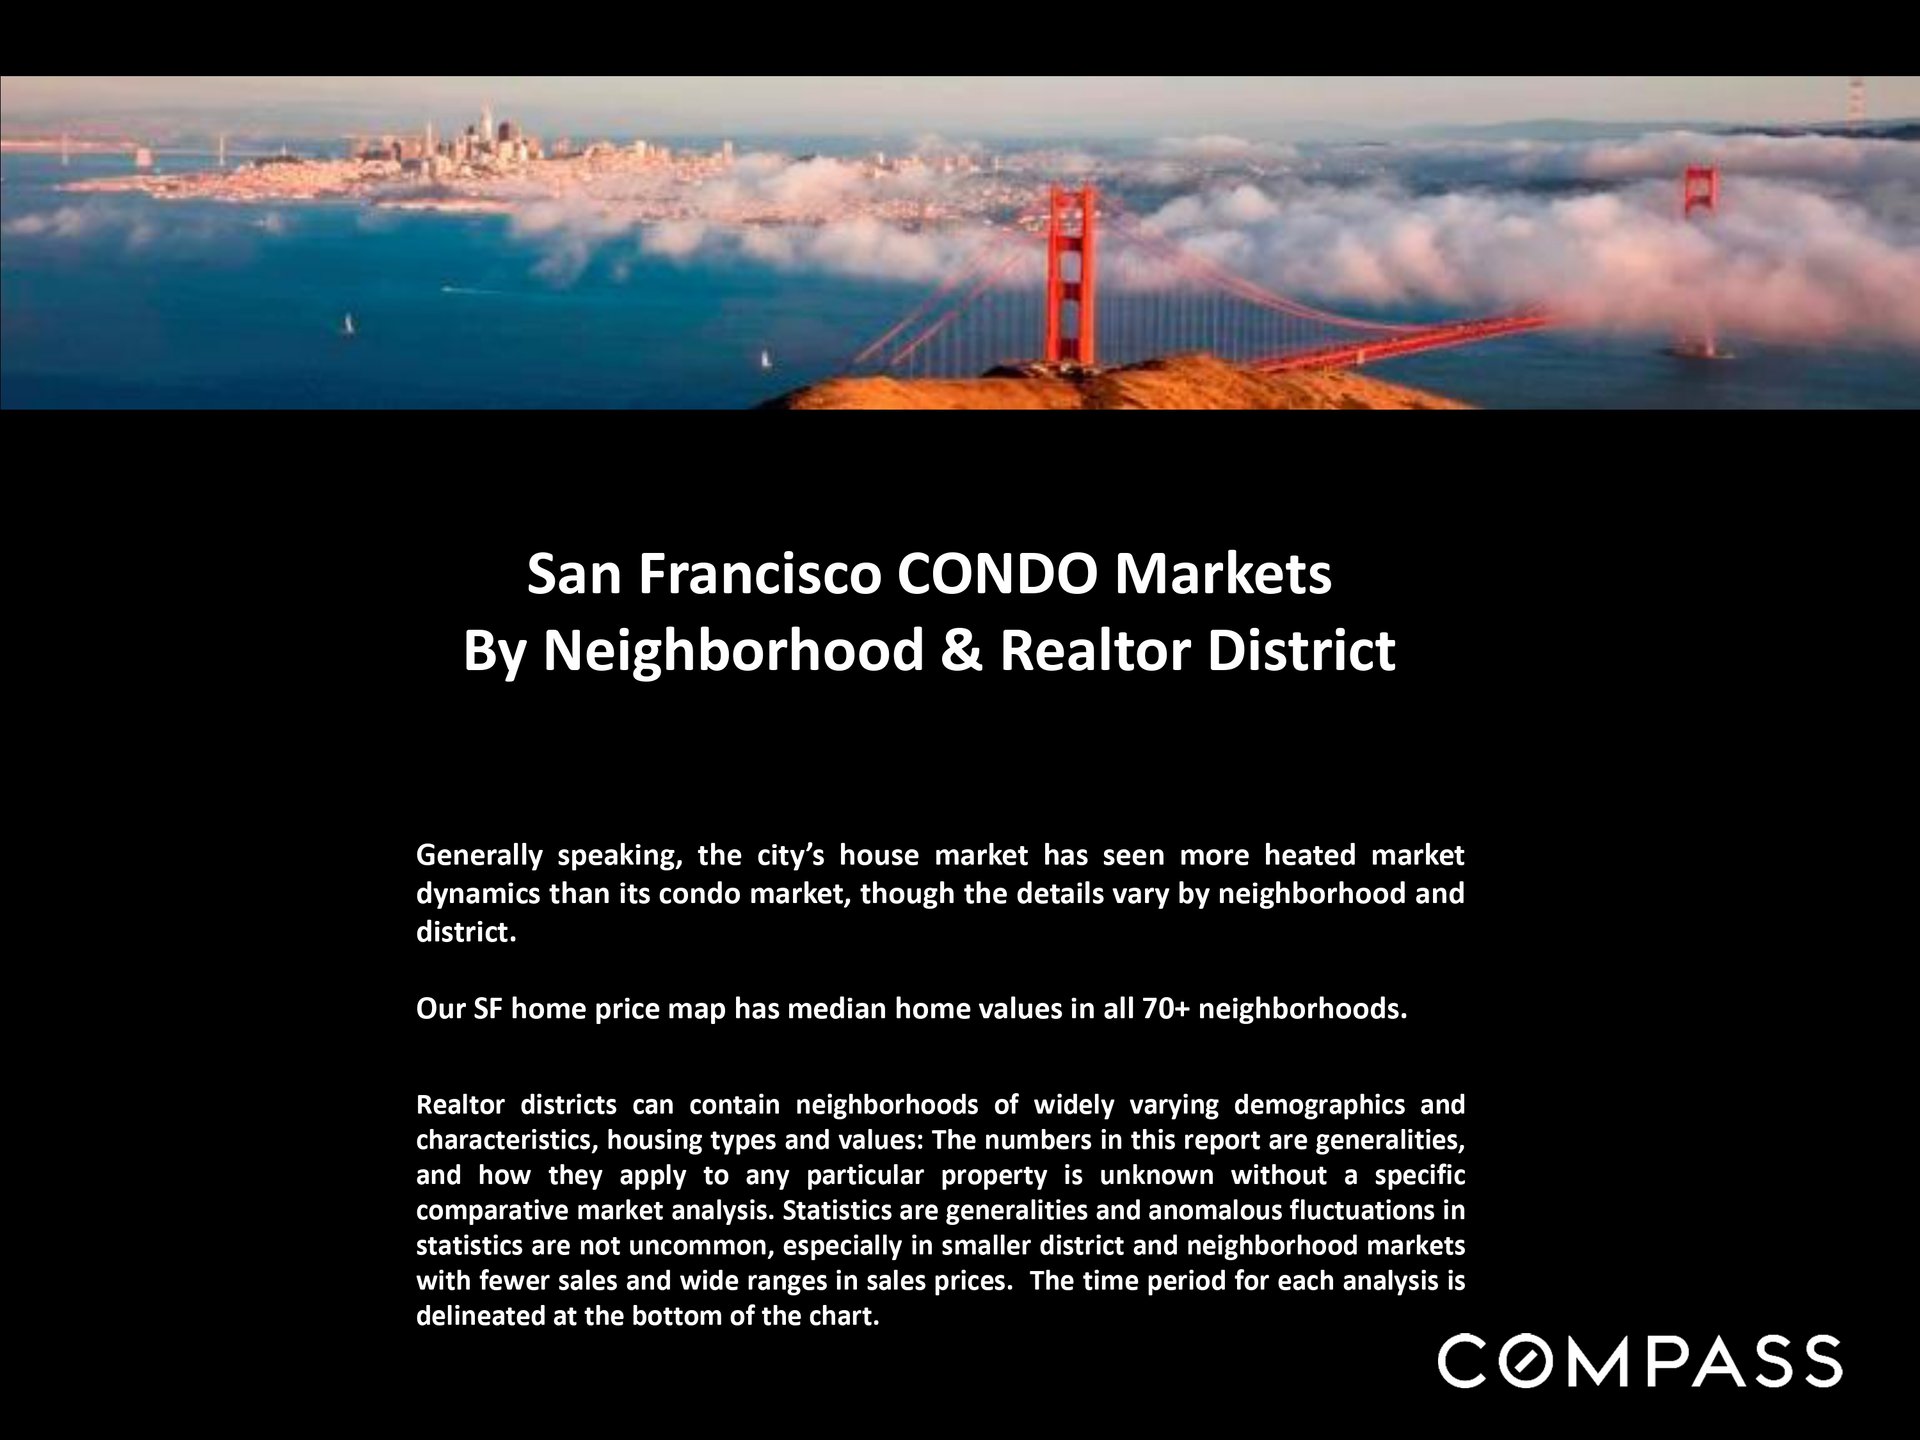
San Francisco condo market report cover with the Golden Gate Bridge in fog and text about neighborhood and Realtor district markets.

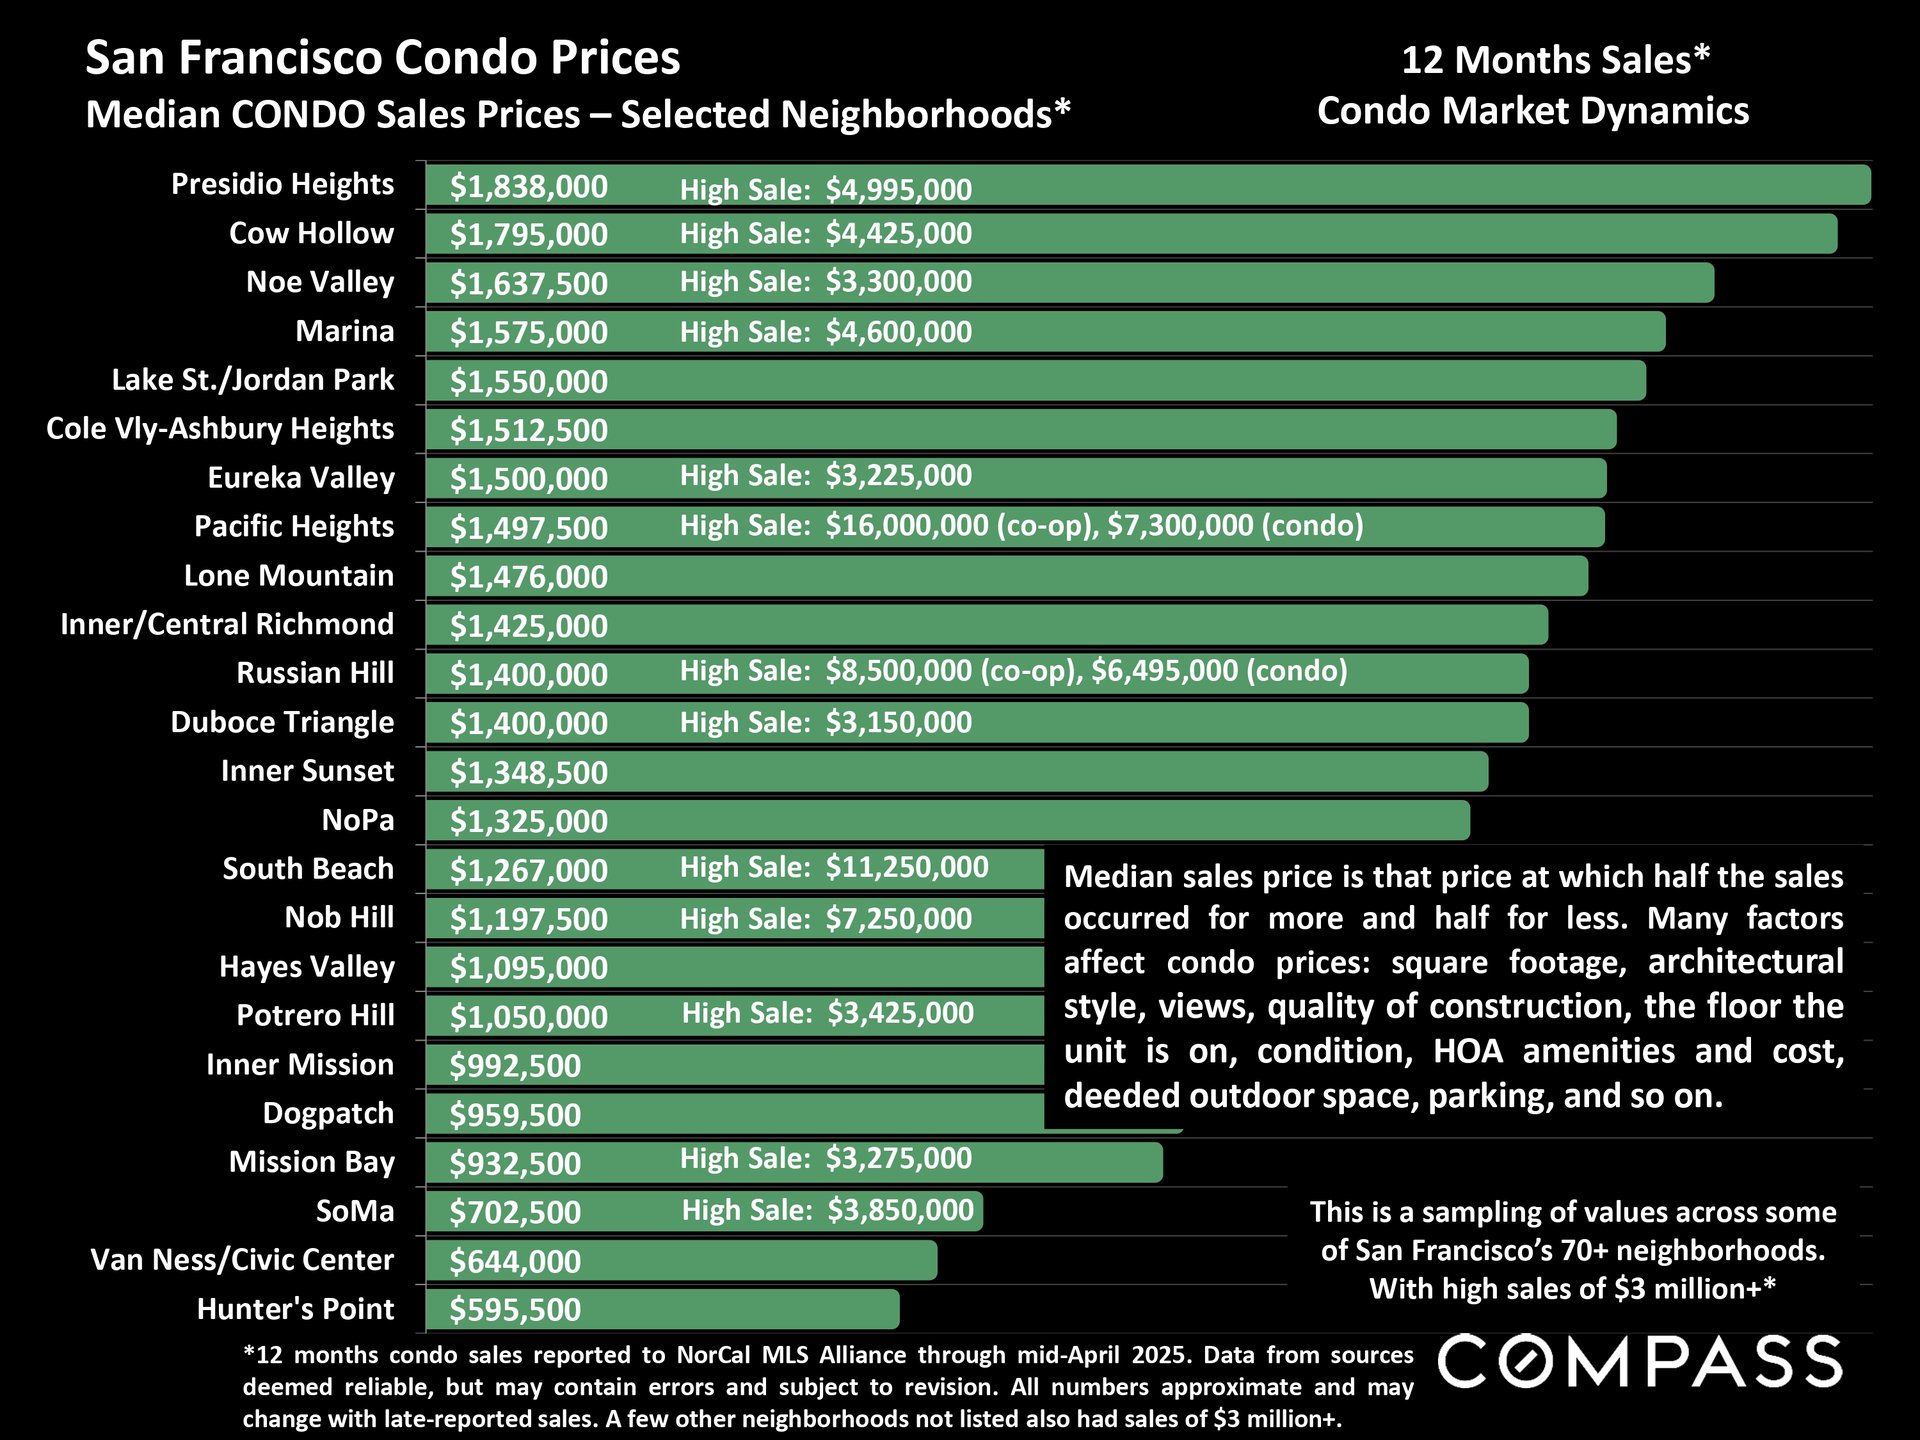
Chart of San Francisco condo median sale prices by neighborhood, with 12-month sales data through April 2025.

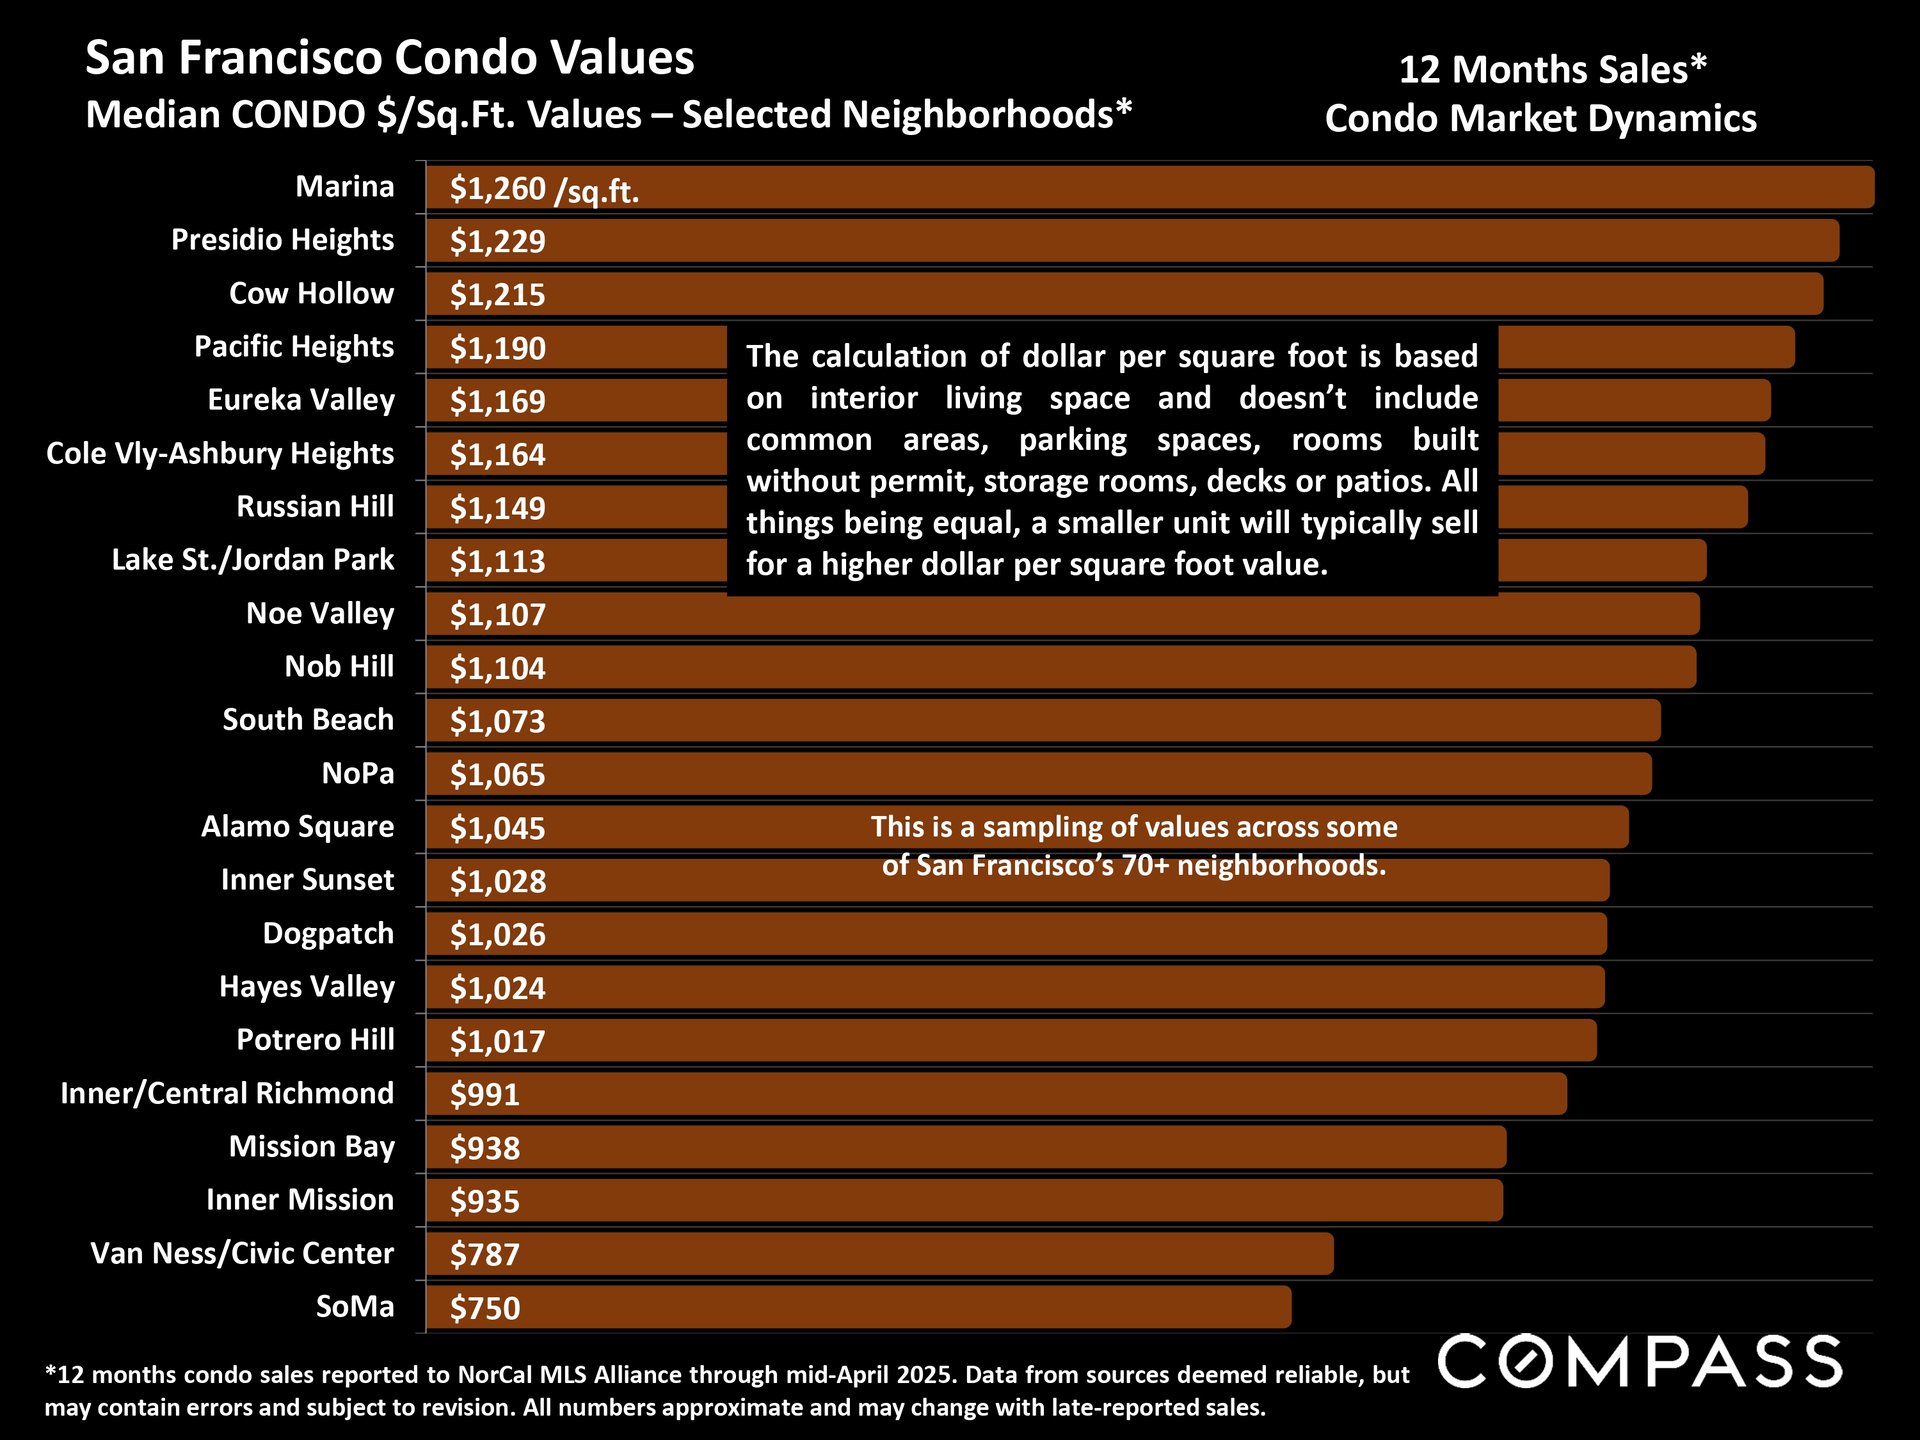
Chart comparing median San Francisco condo prices per square foot across neighborhoods, from Marina at $1,260 to SoMa at $750.

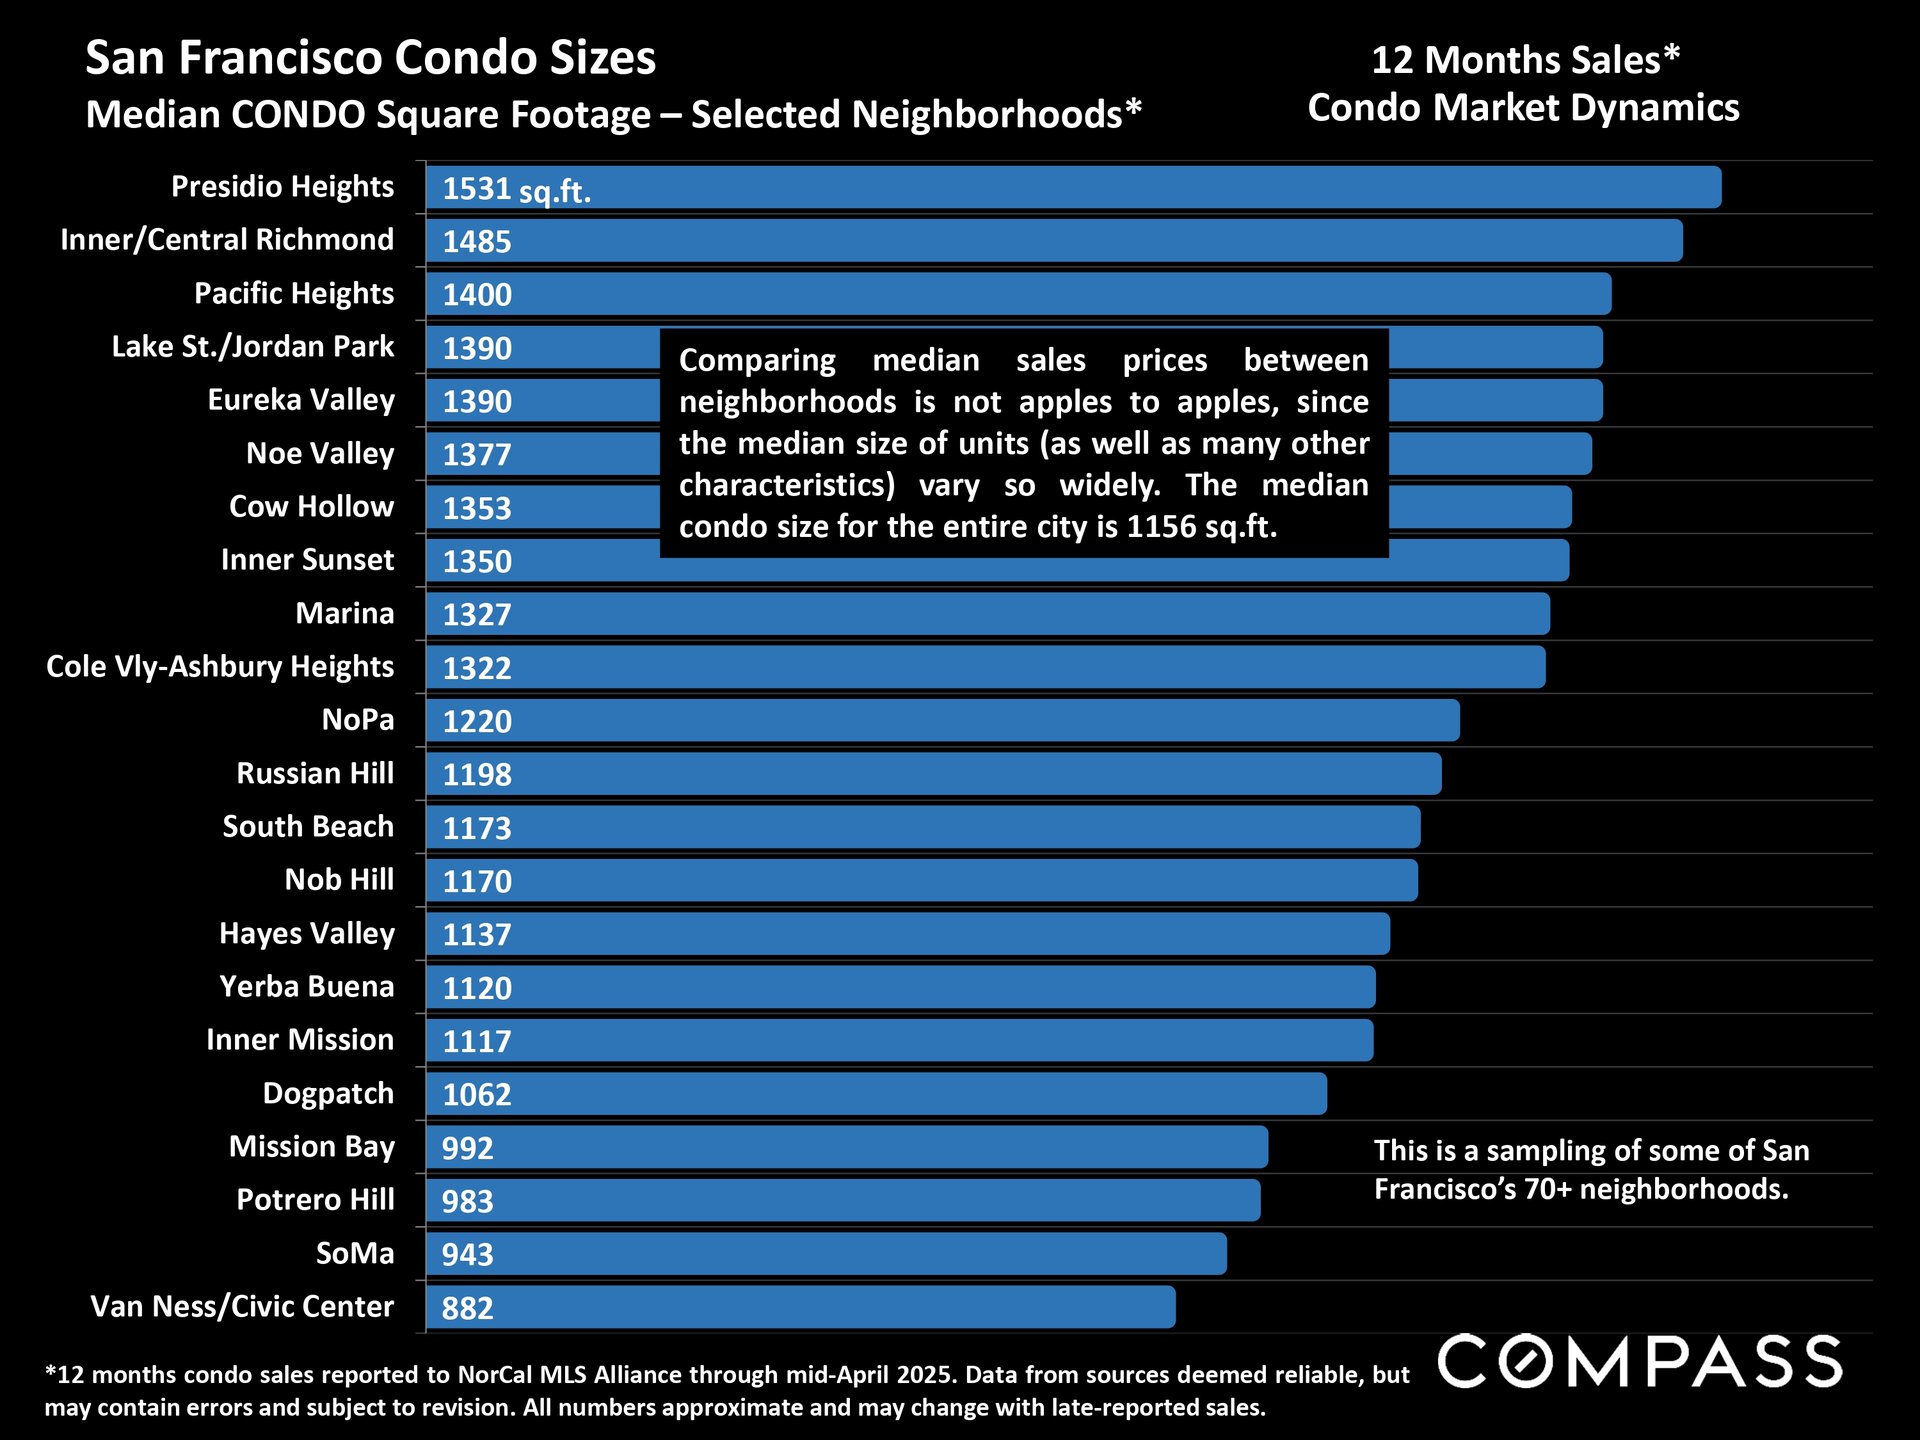
Chart comparing median condo sizes across selected San Francisco neighborhoods, from Presidio Heights to Van Ness/Civic Center.


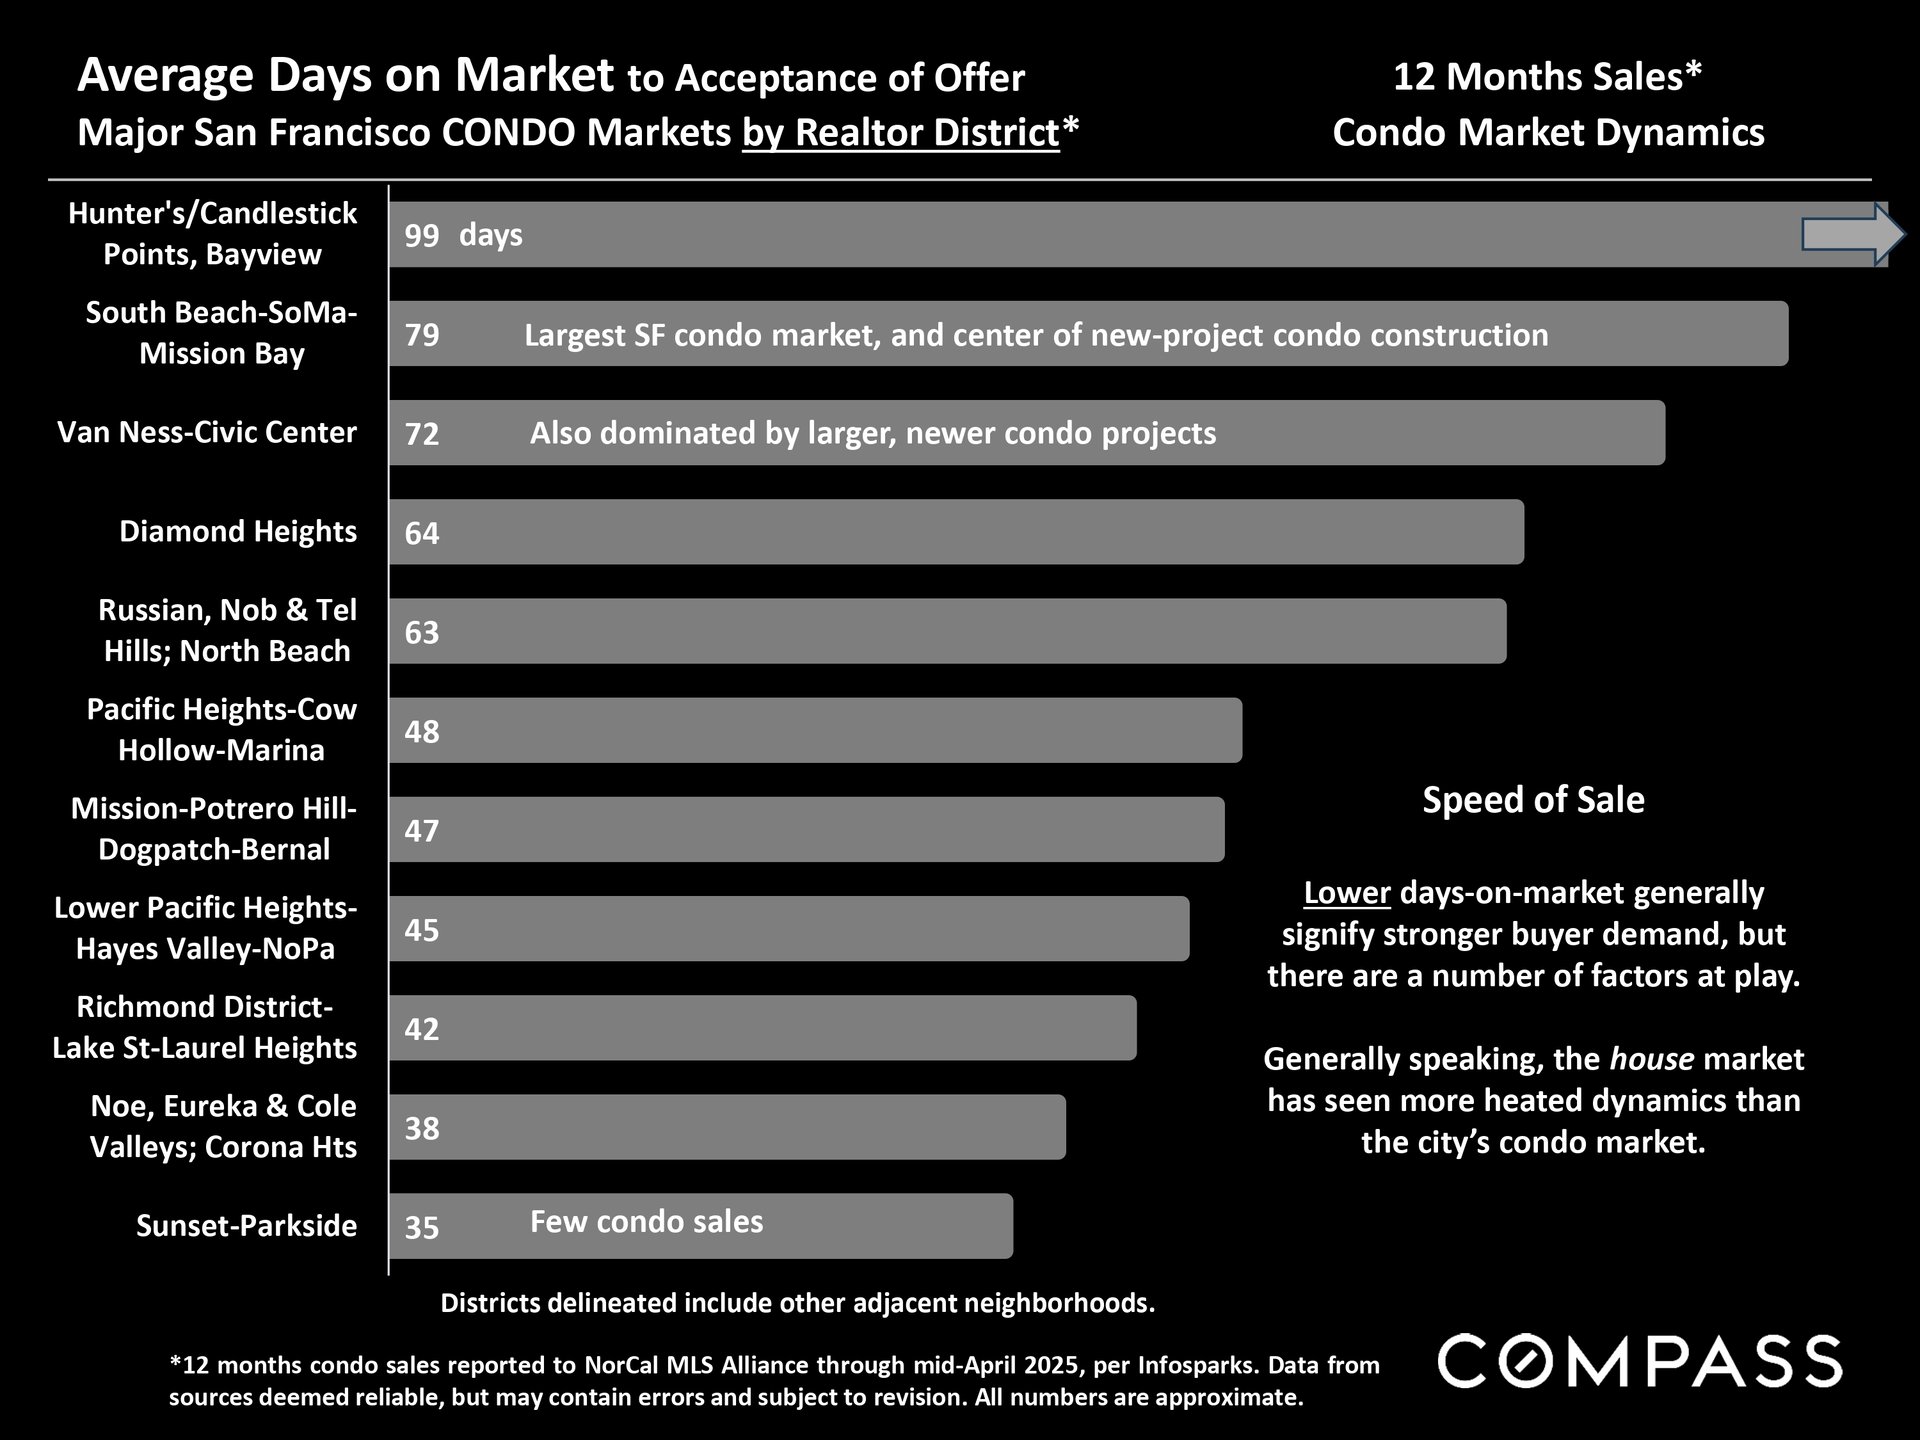
Infographic comparing days on market for San Francisco condo neighborhoods, from 99 days in Bayview to 35 in Sunset-Parkside.

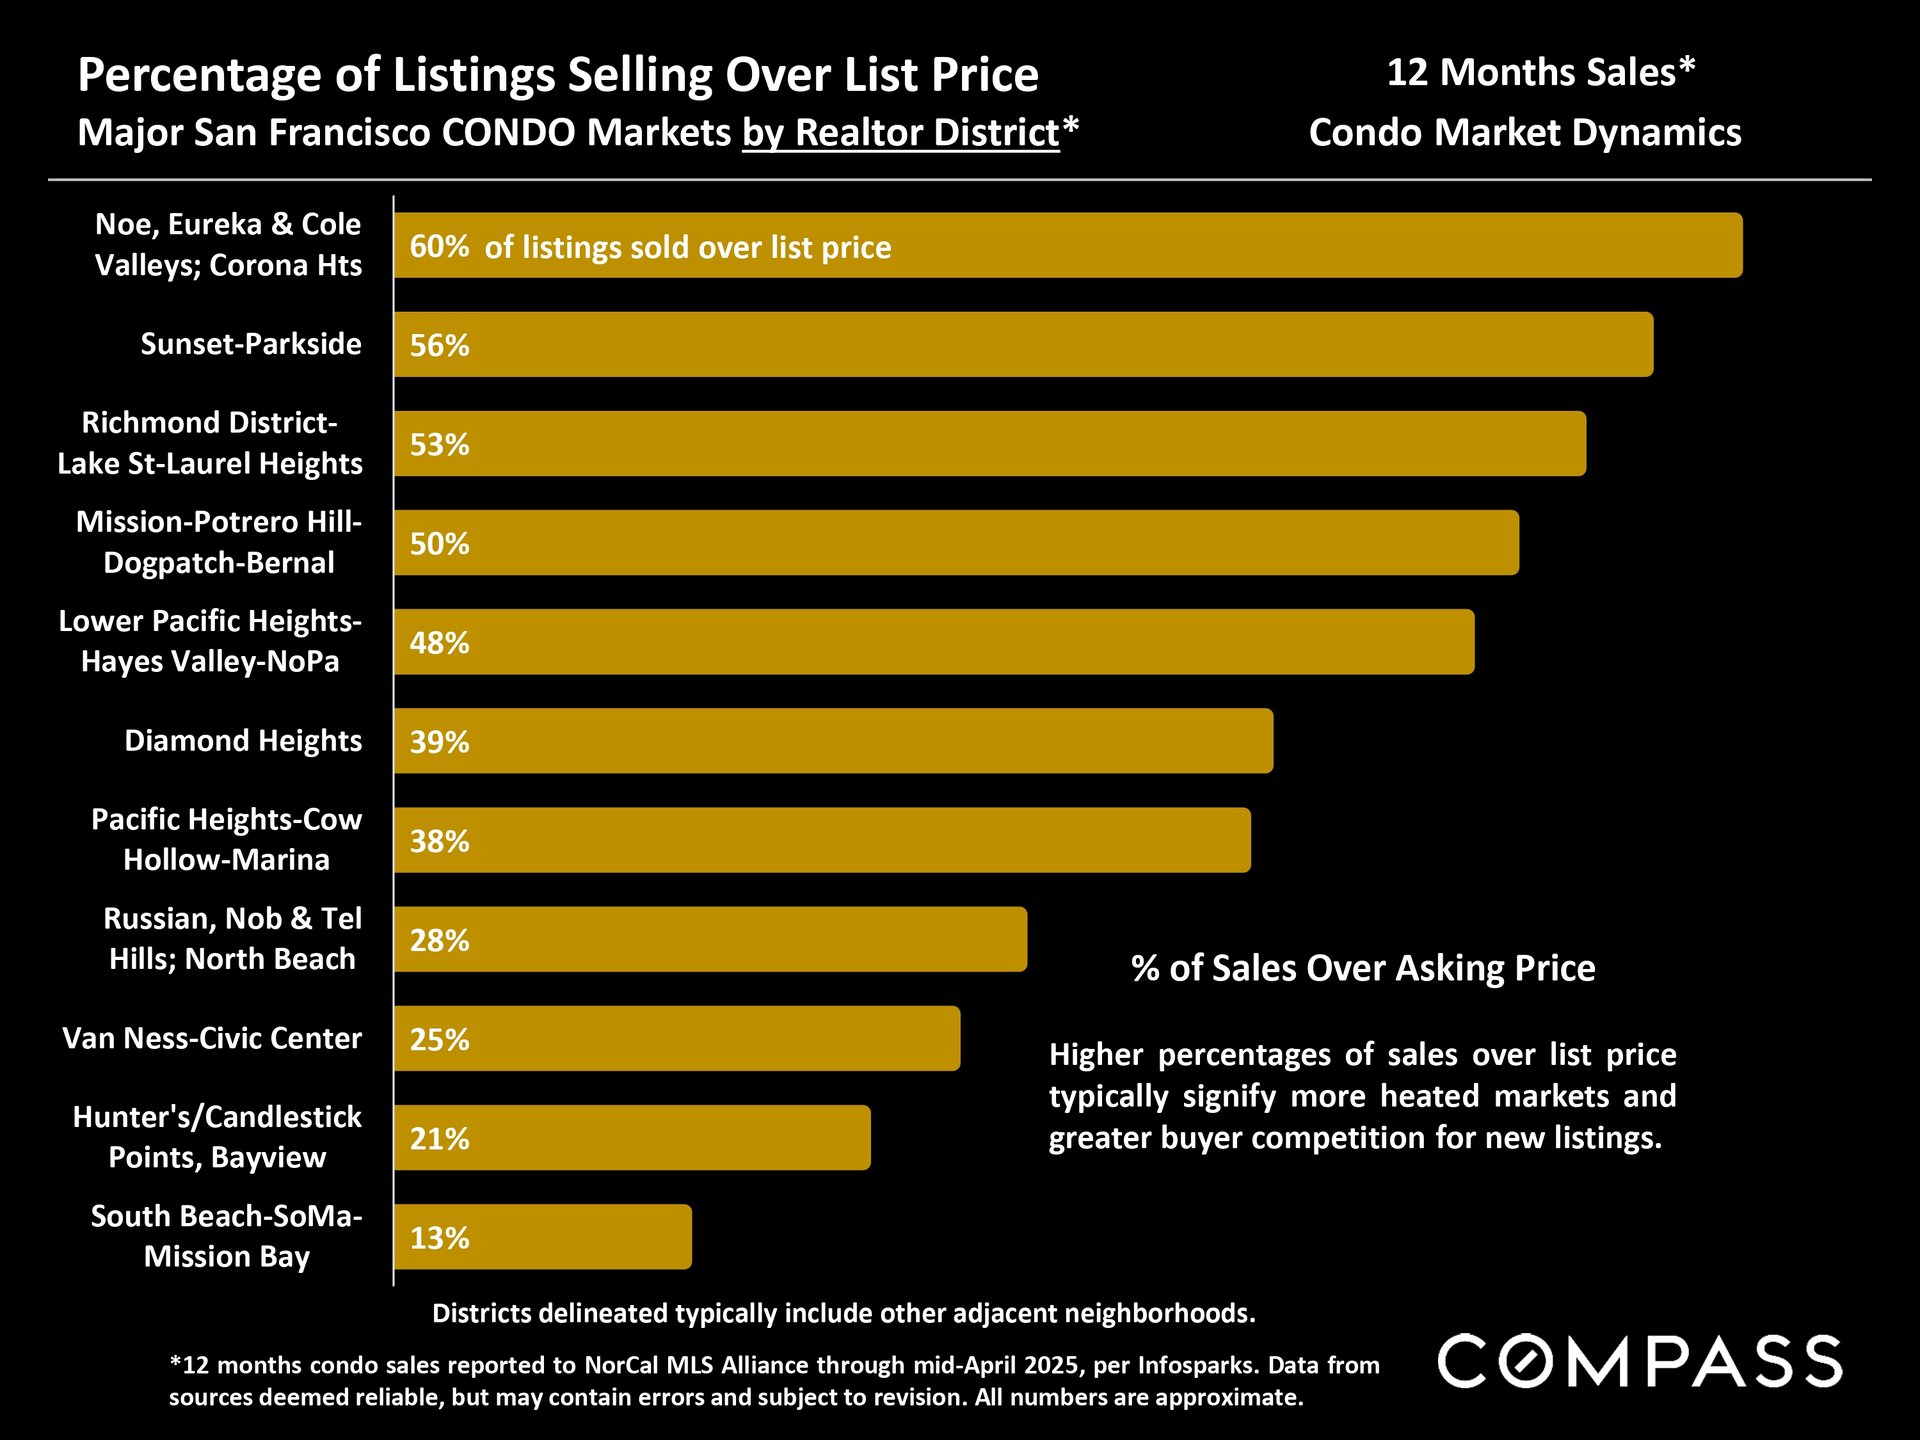
Chart of San Francisco condo listings selling over list price by district, ranging from 60% to 13%.

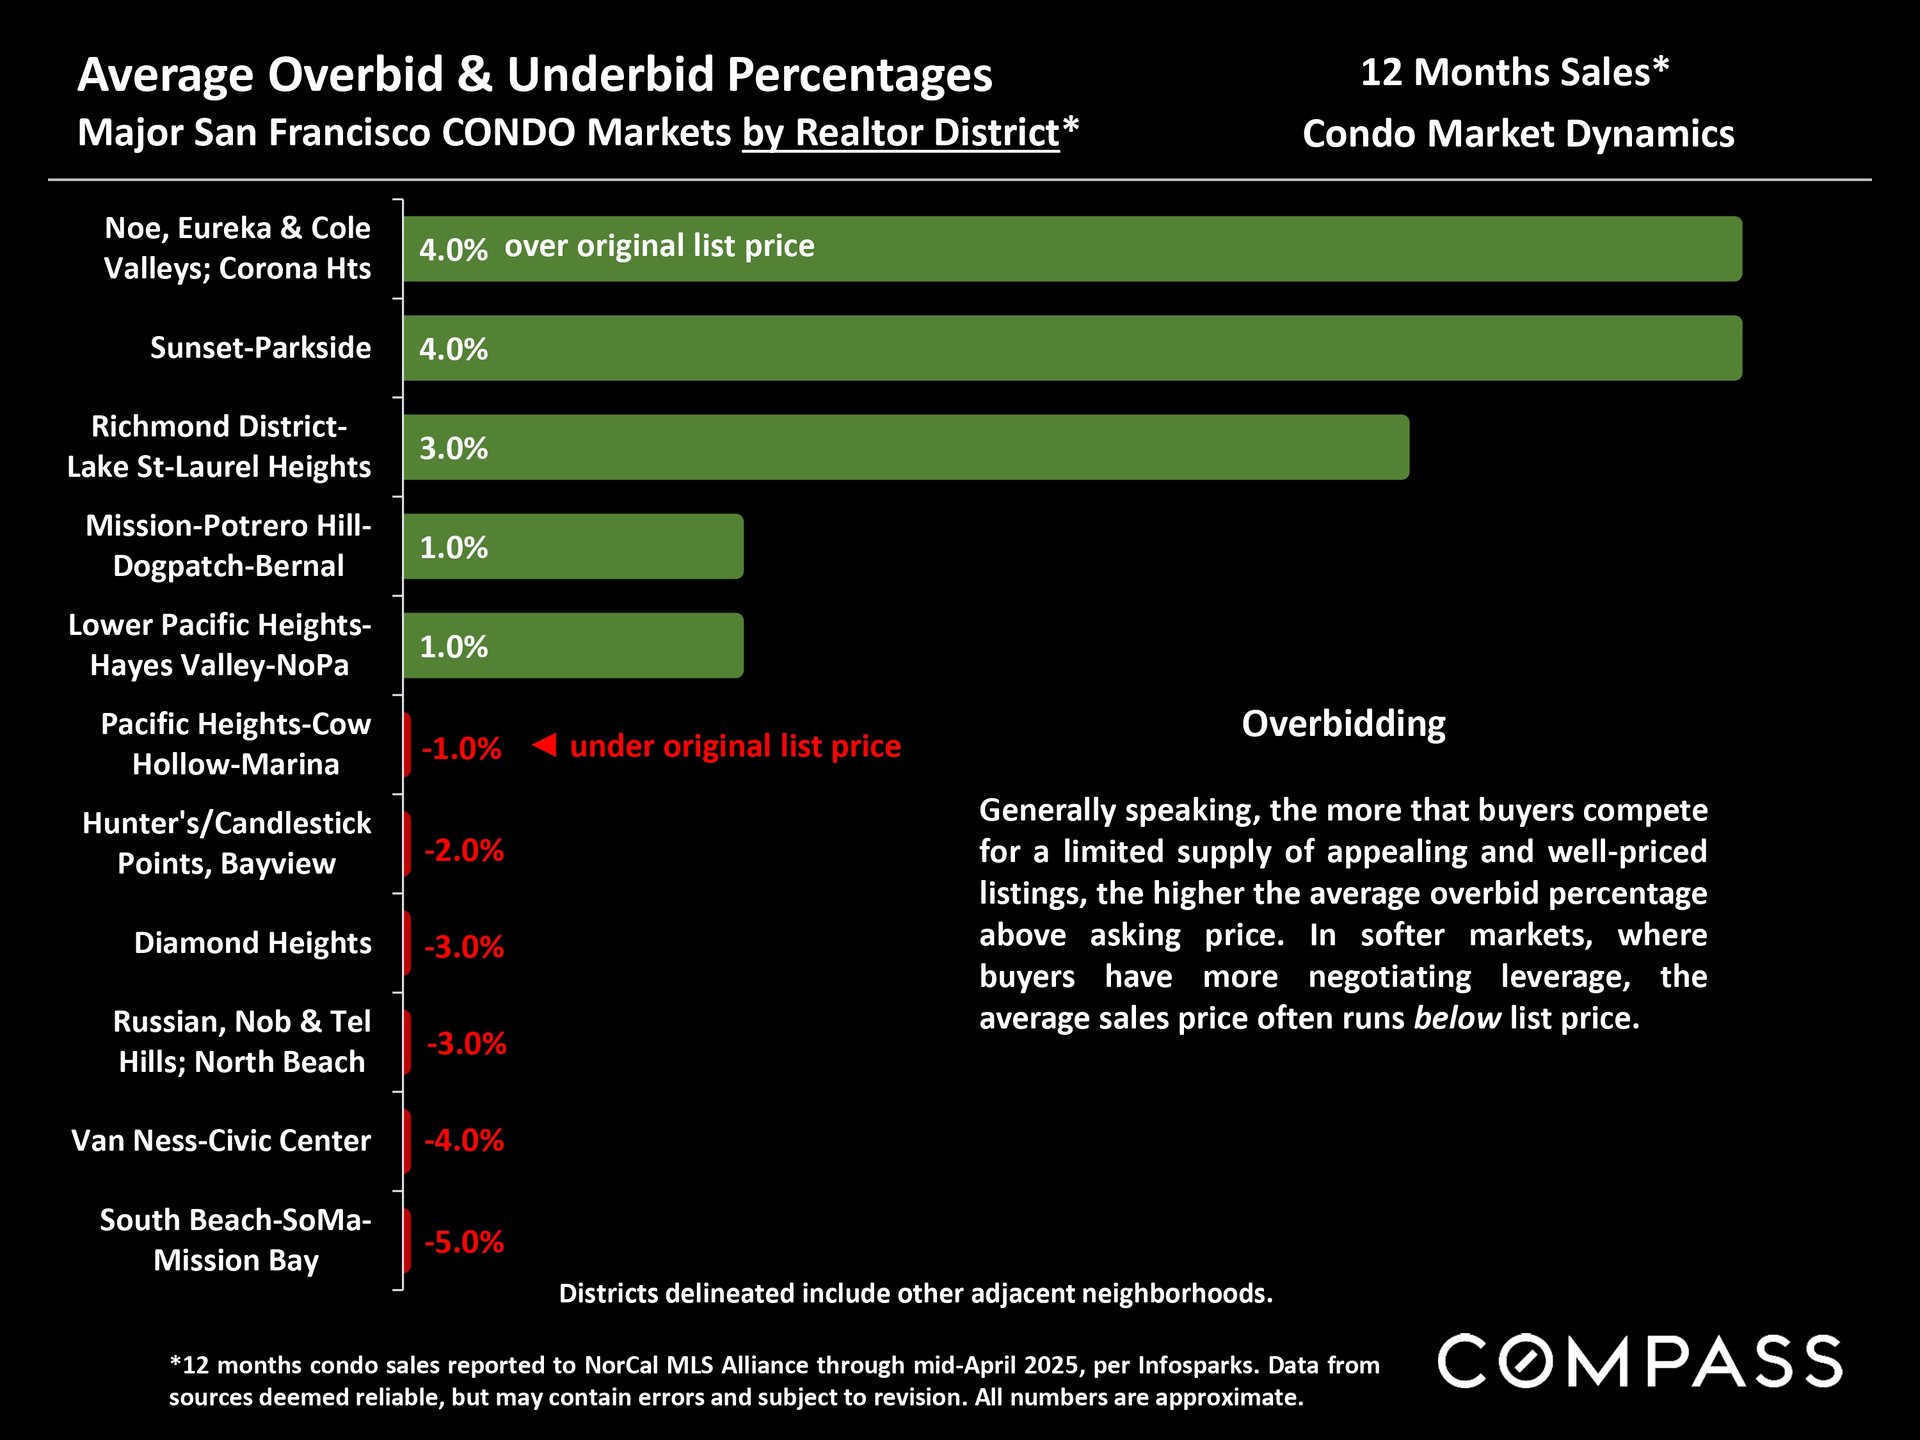
Bar chart of San Francisco condo overbid and underbid percentages by neighborhood, ranging from 4% over to 5% under list price.

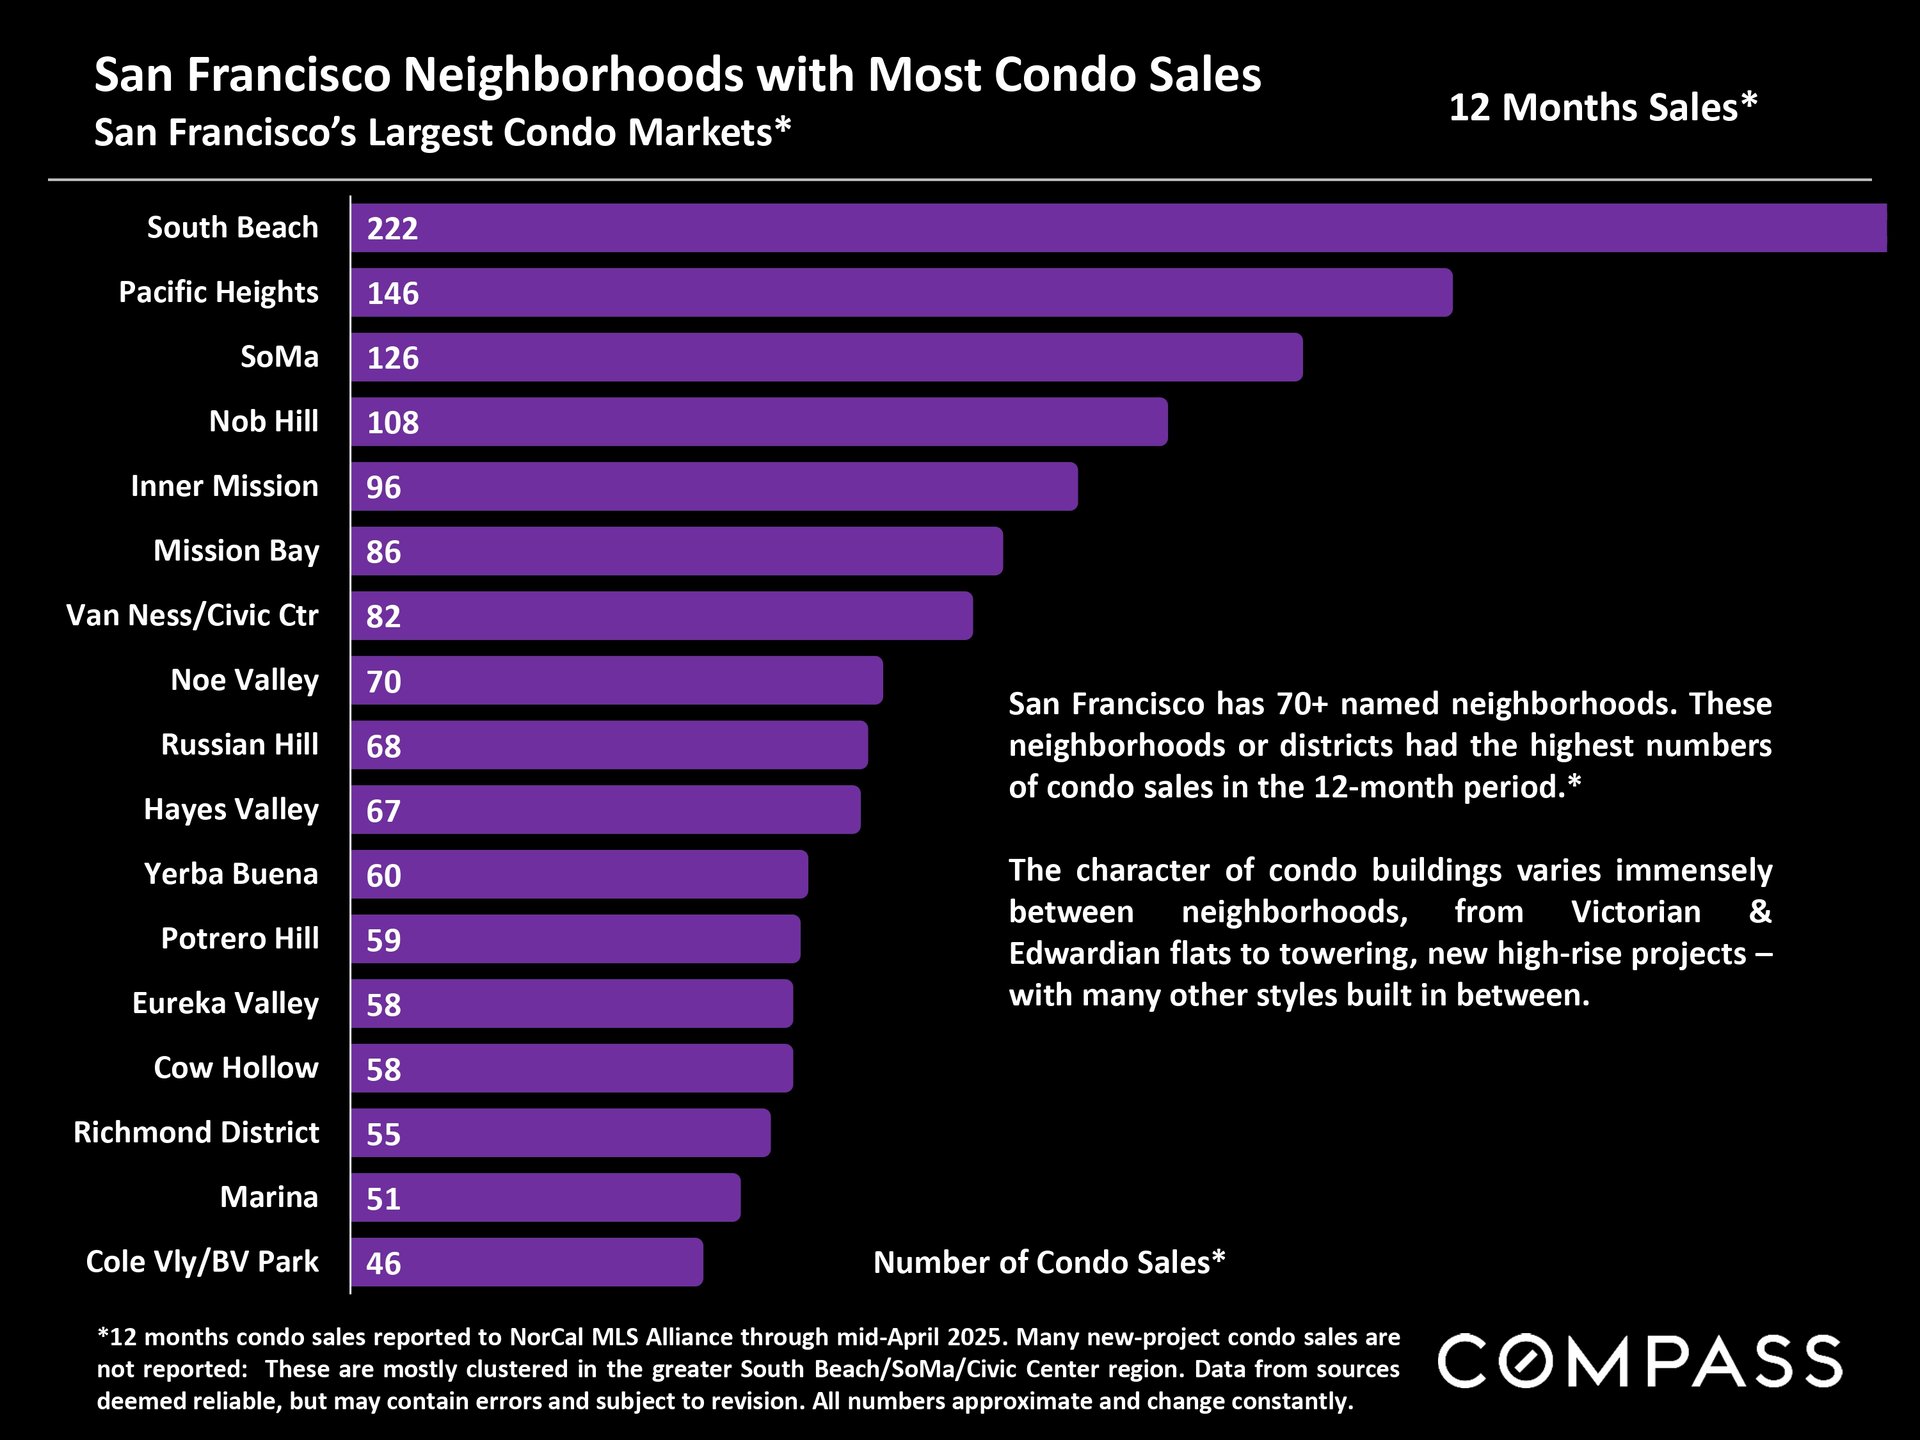
Bar chart of San Francisco condo sales by neighborhood, led by South Beach with 222 sales and Pacific Heights with 146.

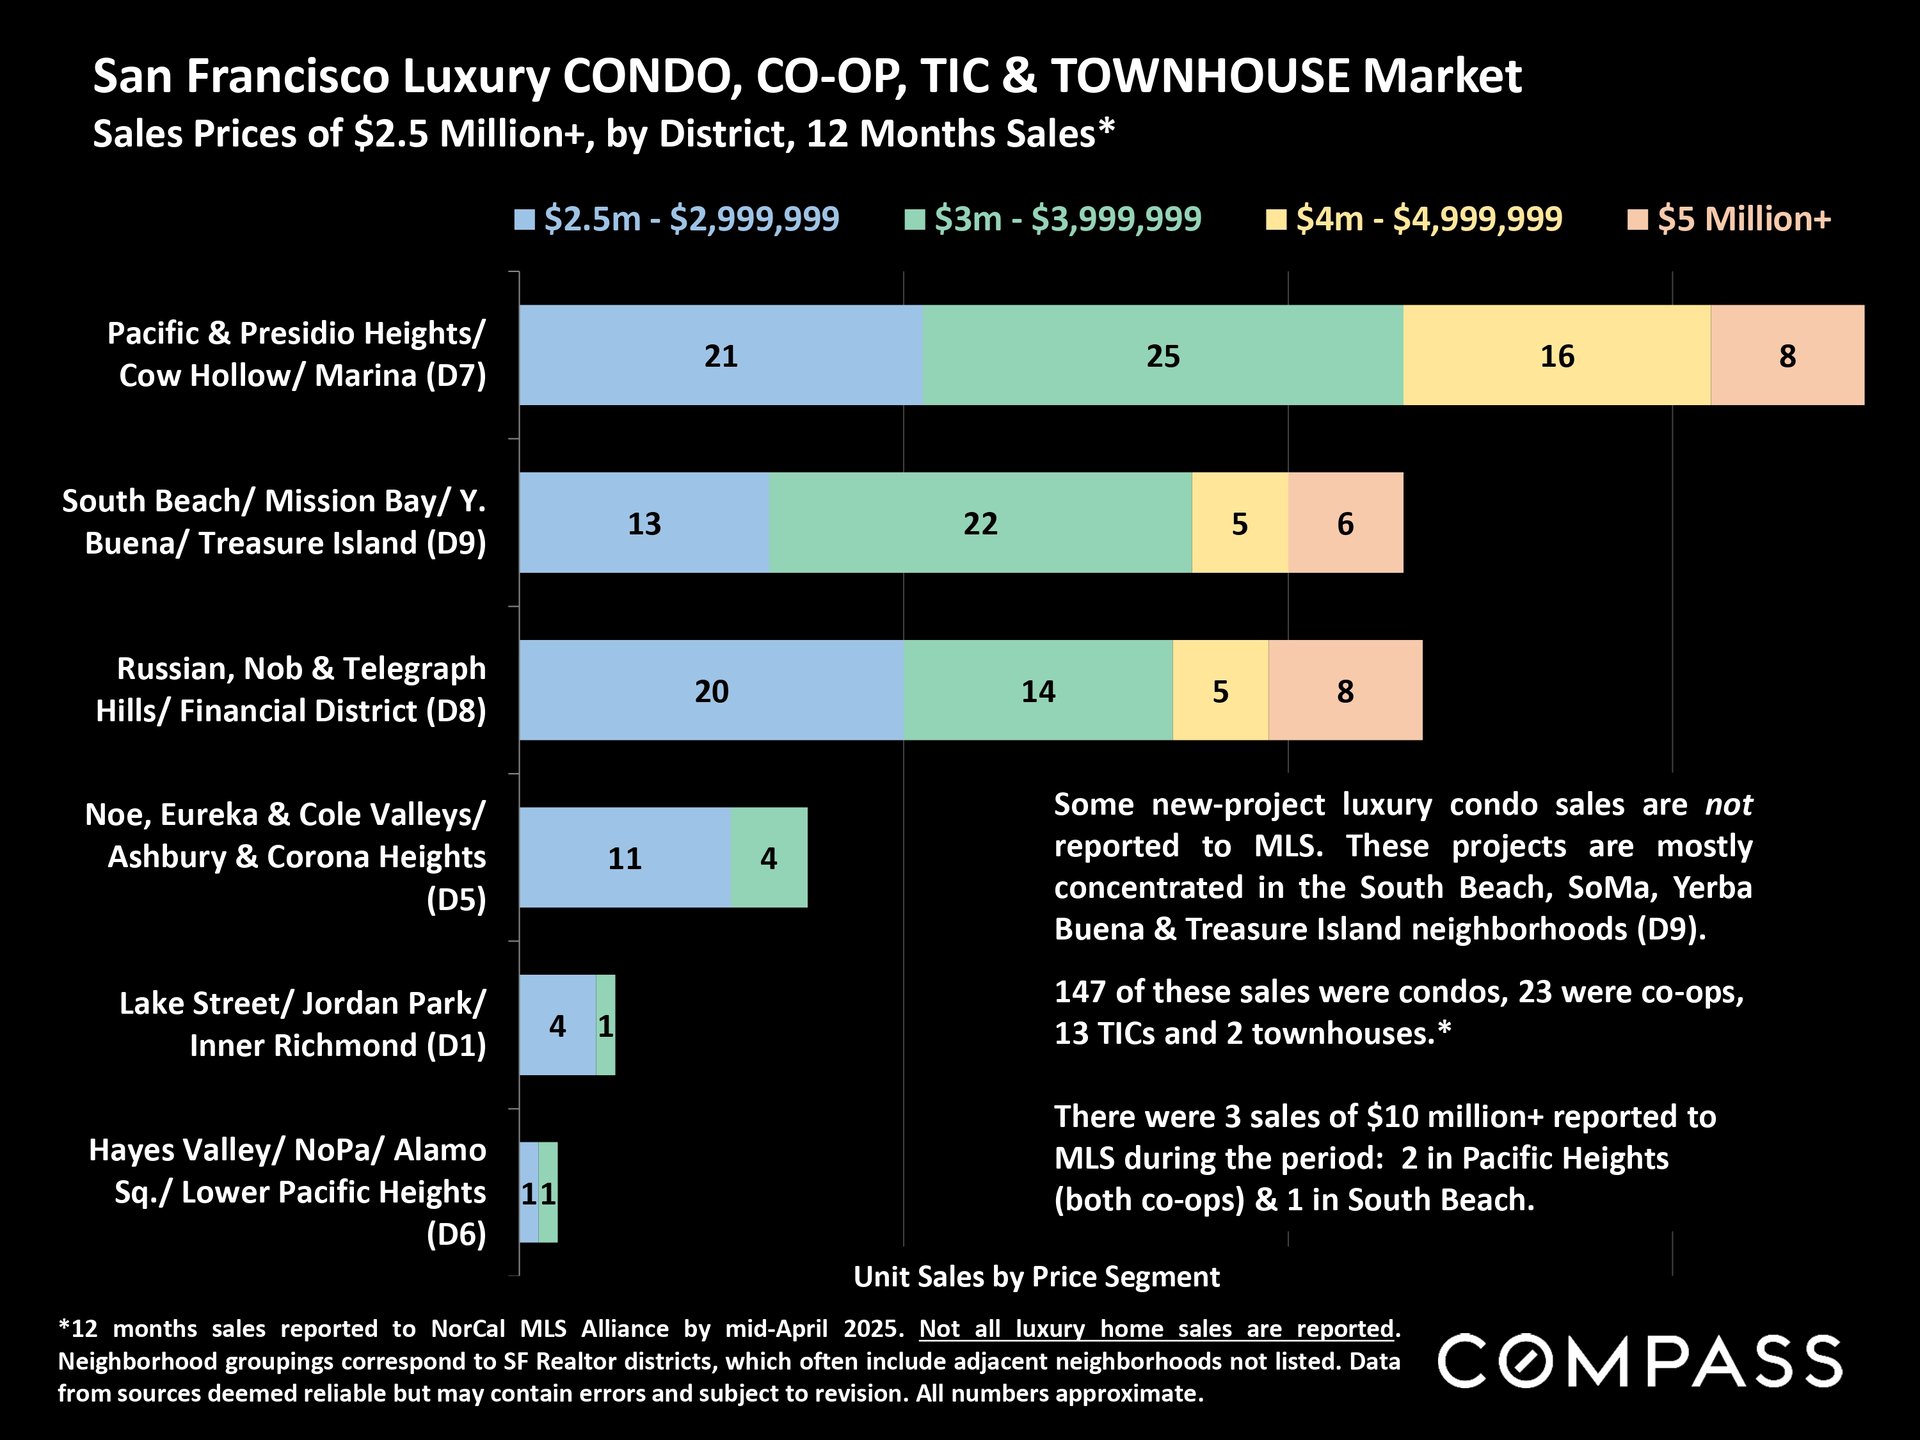
San Francisco luxury condo, co-op, TIC, and townhouse sales chart by district and price segment.

Bay Area by County


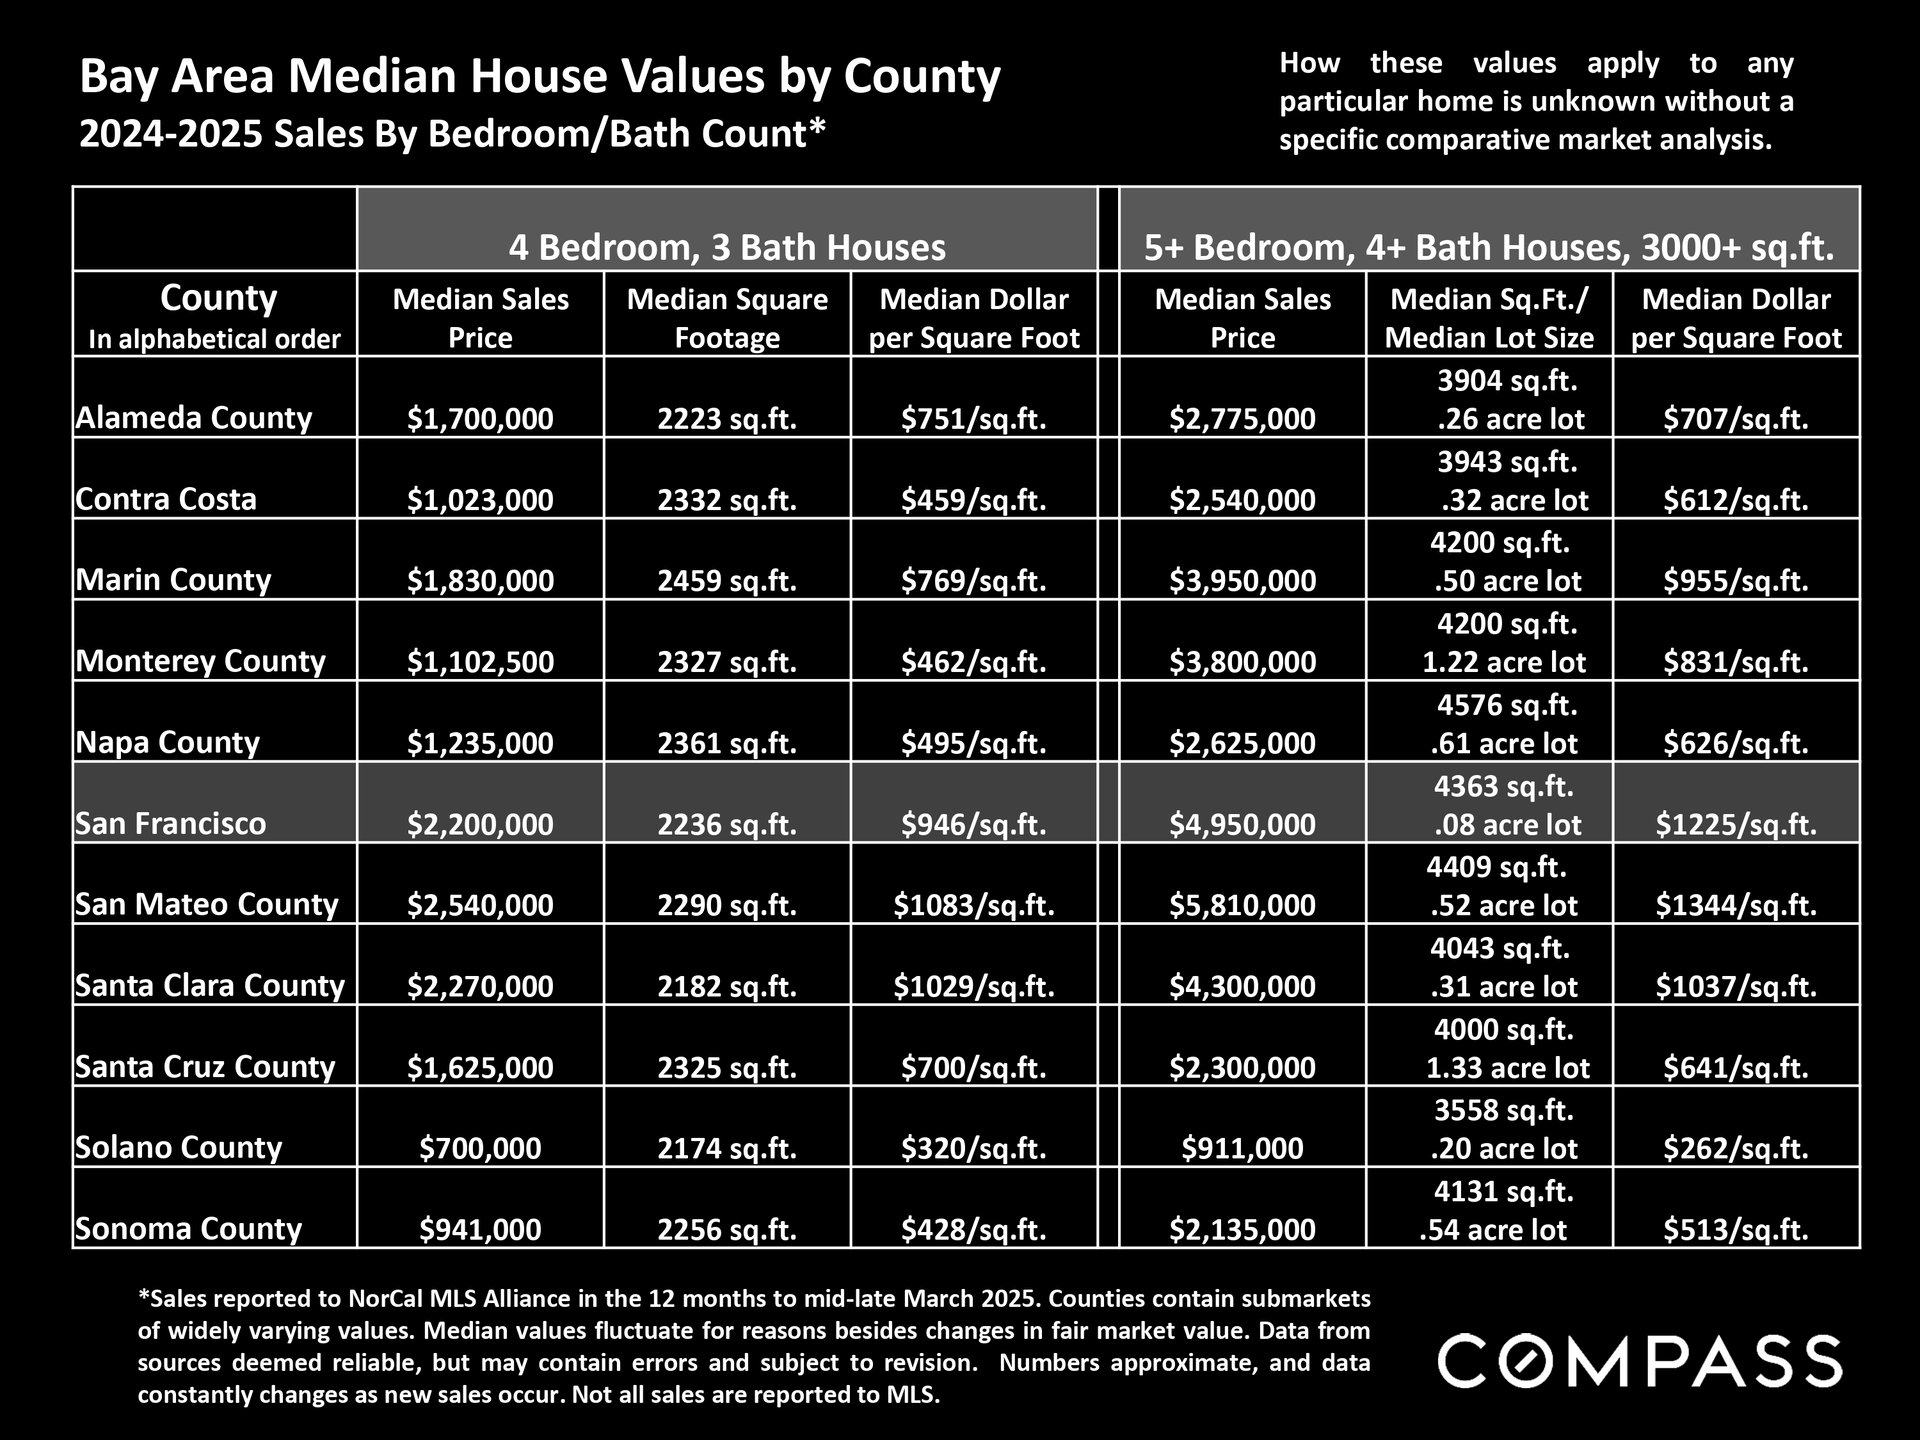
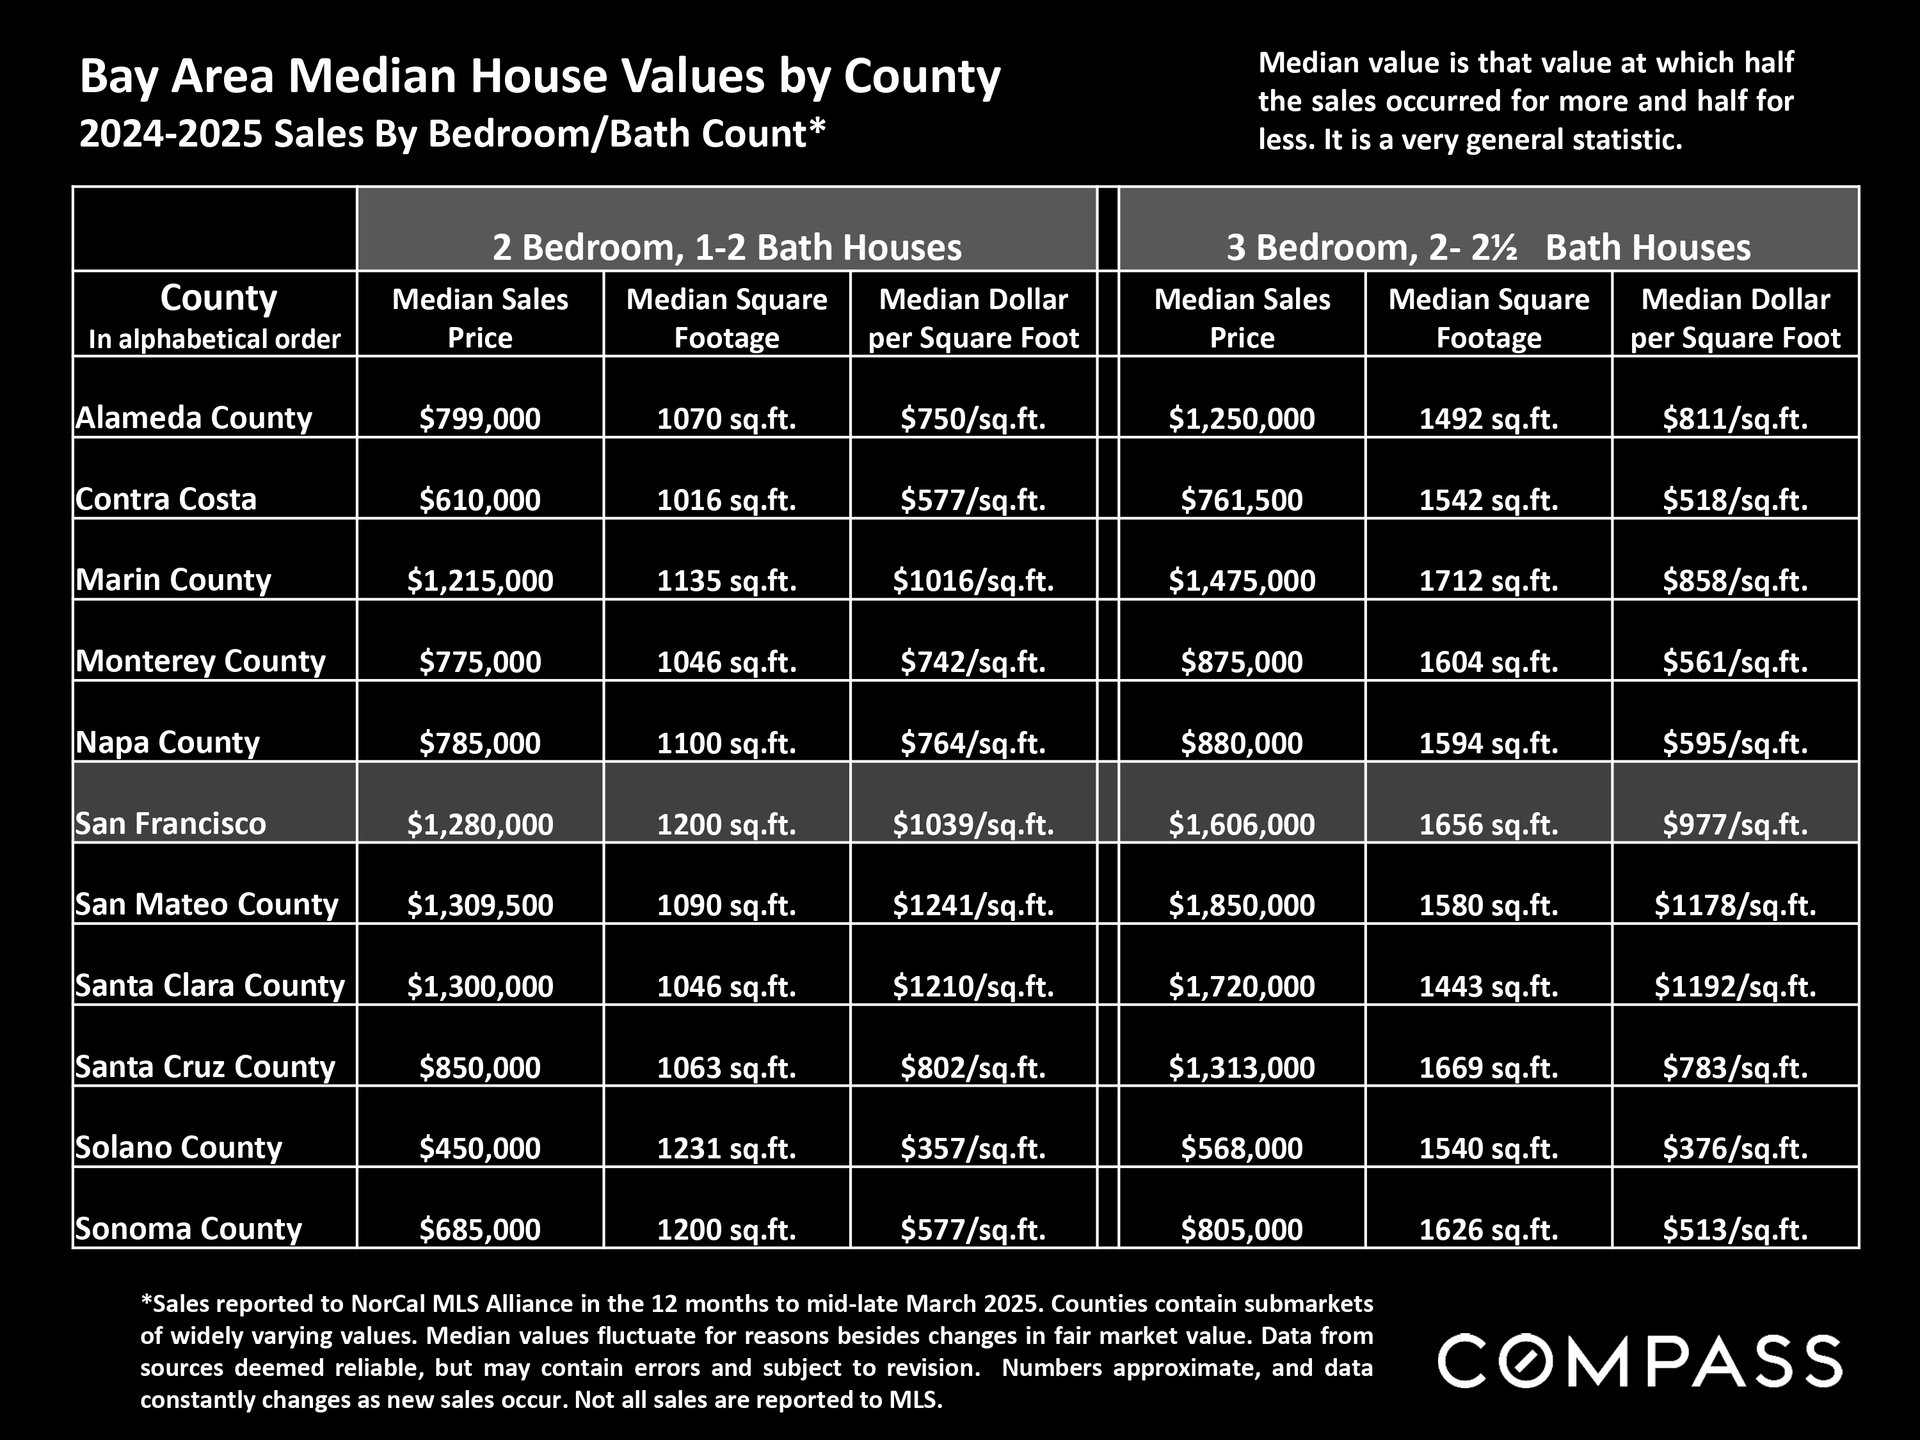
Bay Area median house values by county, comparing sale prices and home sizes across two bedroom and bath categories.

Table comparing 2024–2025 Bay Area county home values by bedroom count, with median prices, square footage, and price per square foot.


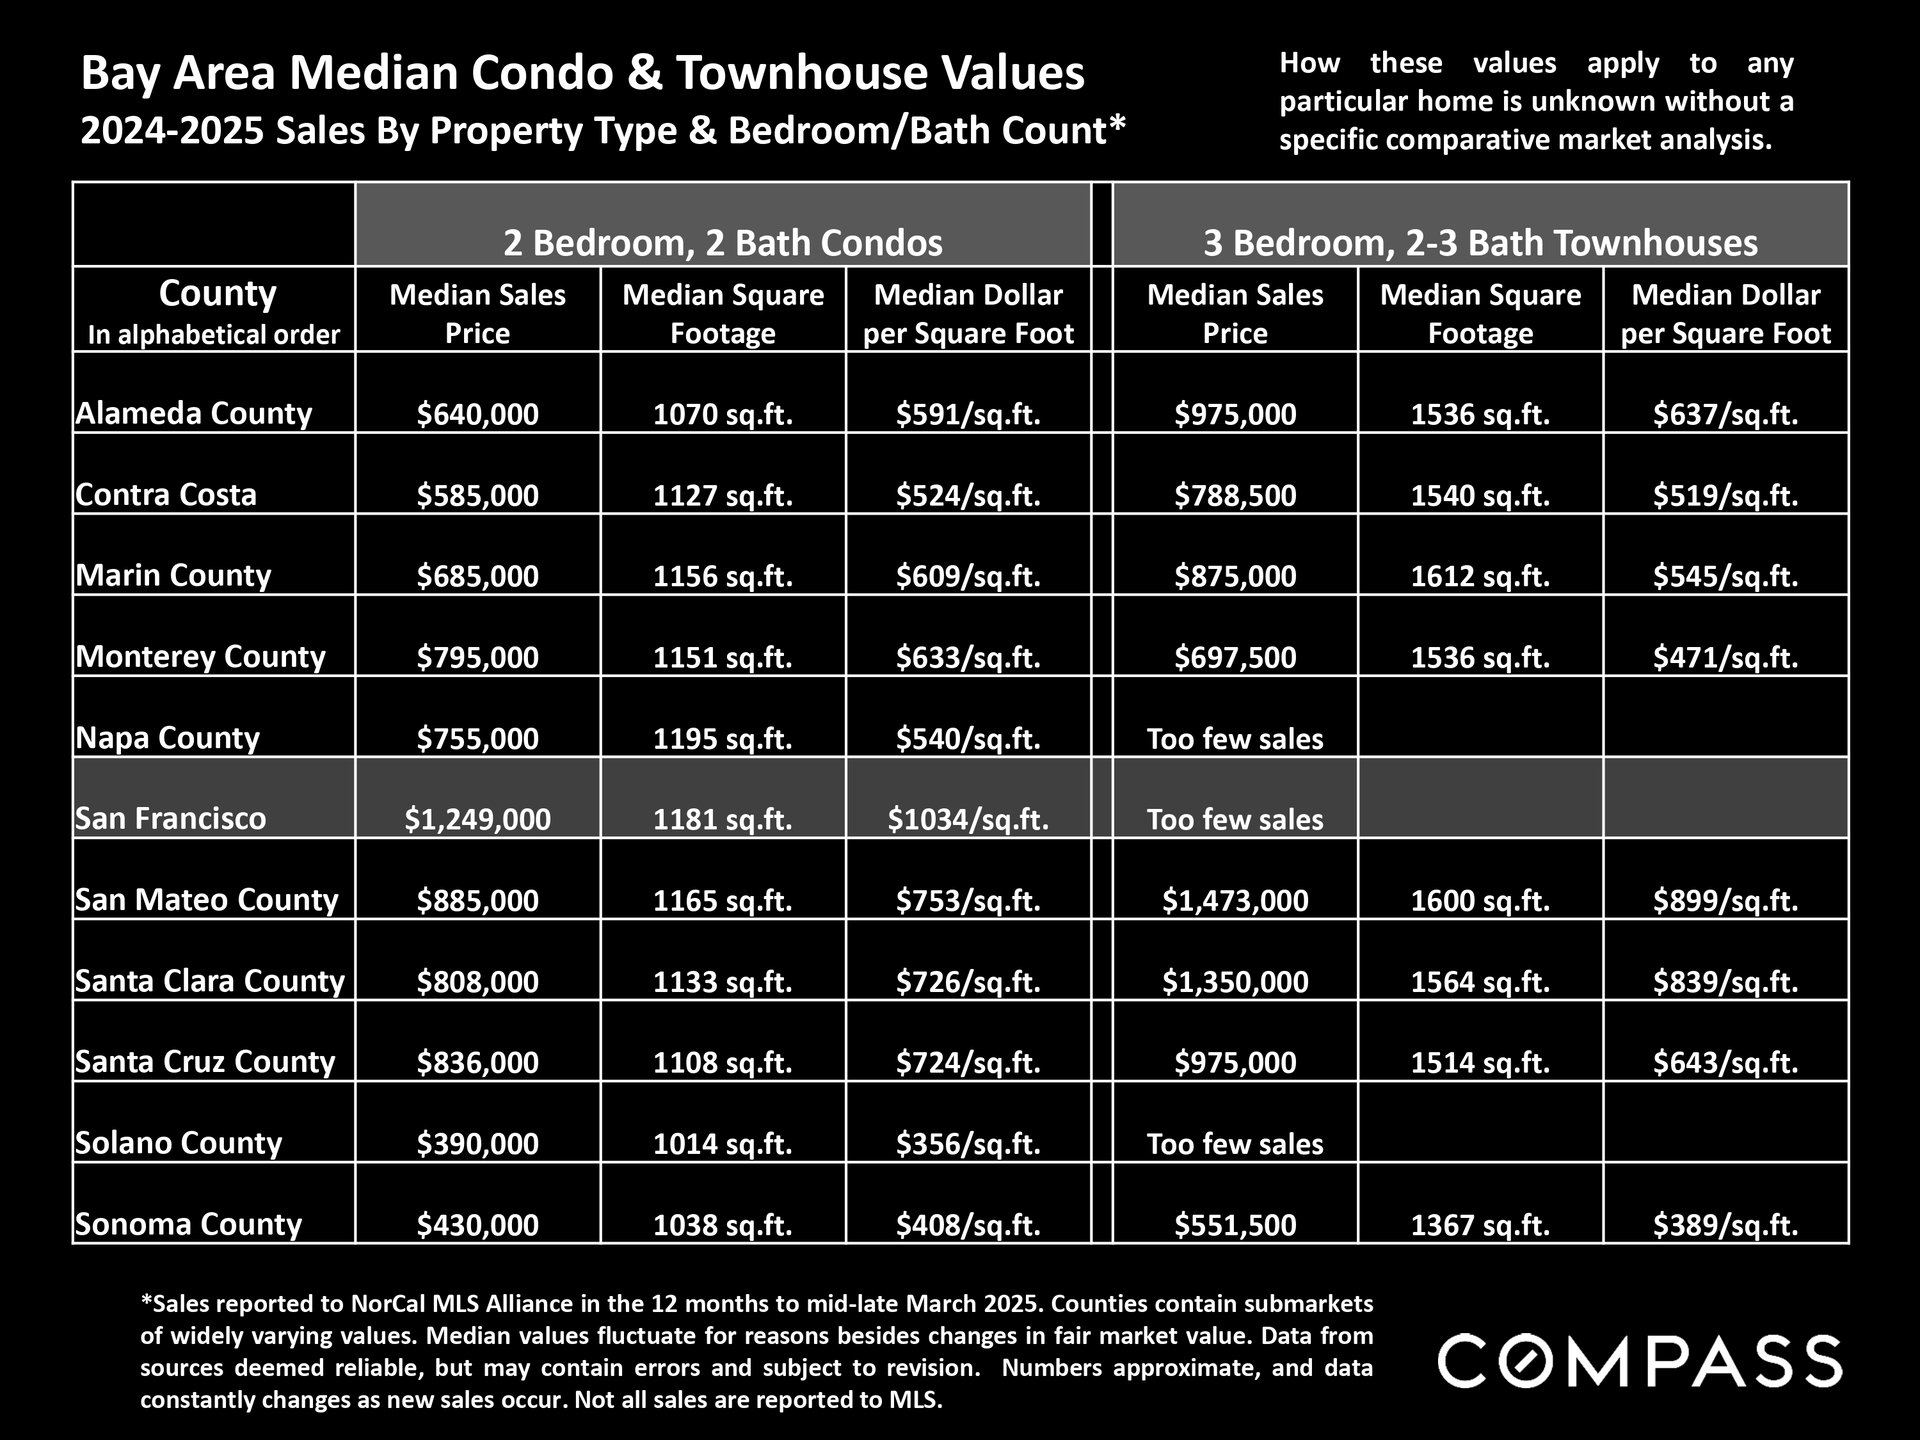
Bay Area 2024–2025 median condo and townhouse values by county, property type, price, square footage, and price per square foot.

San Francisco Annual Median Sales Prices Since 2012
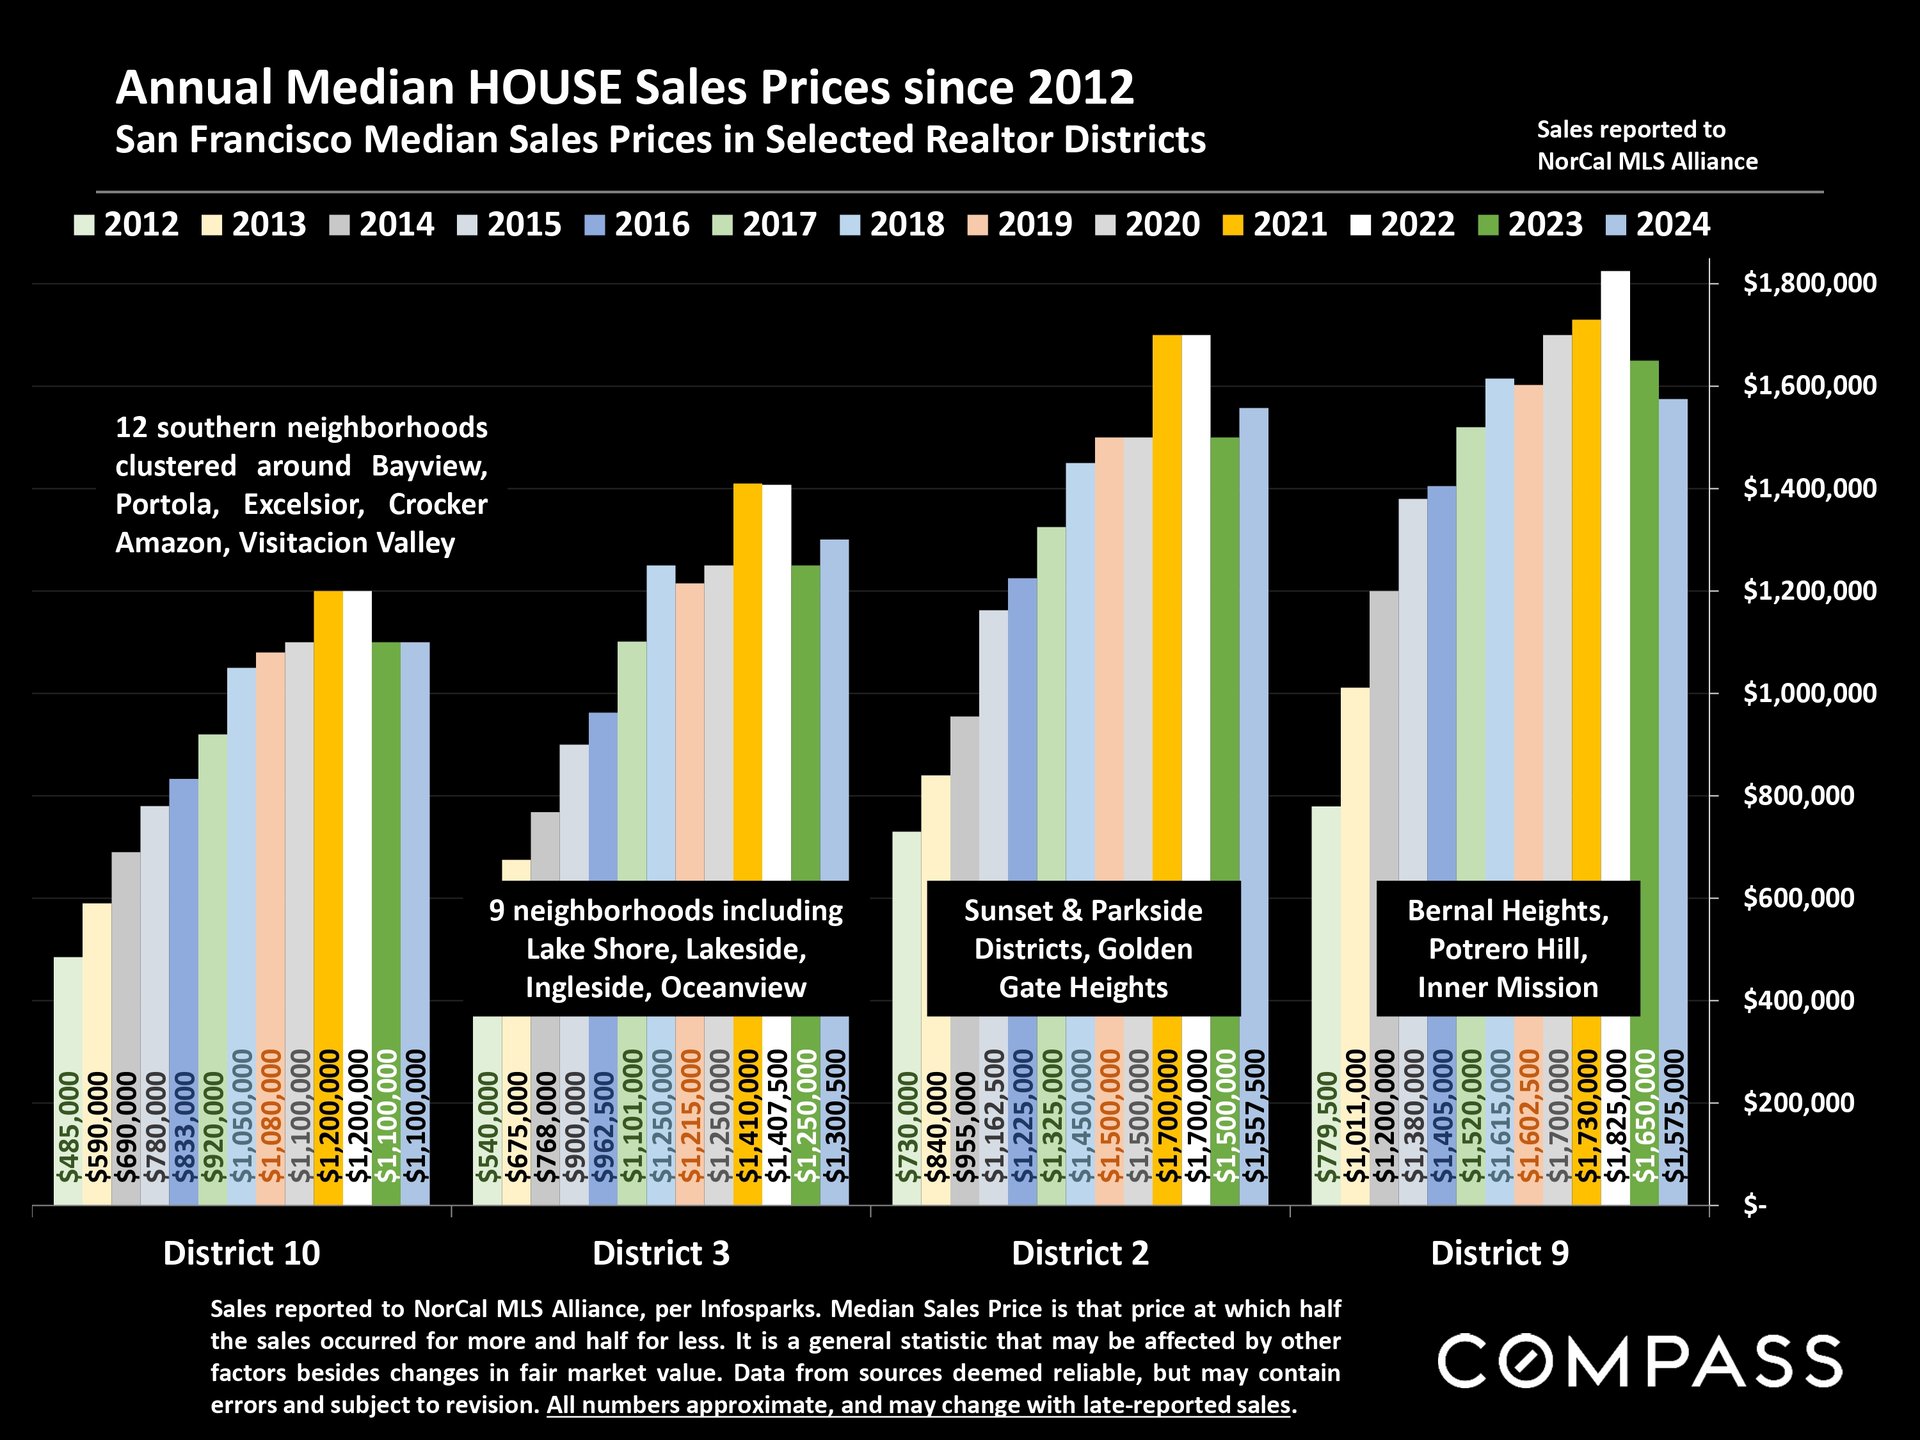
 

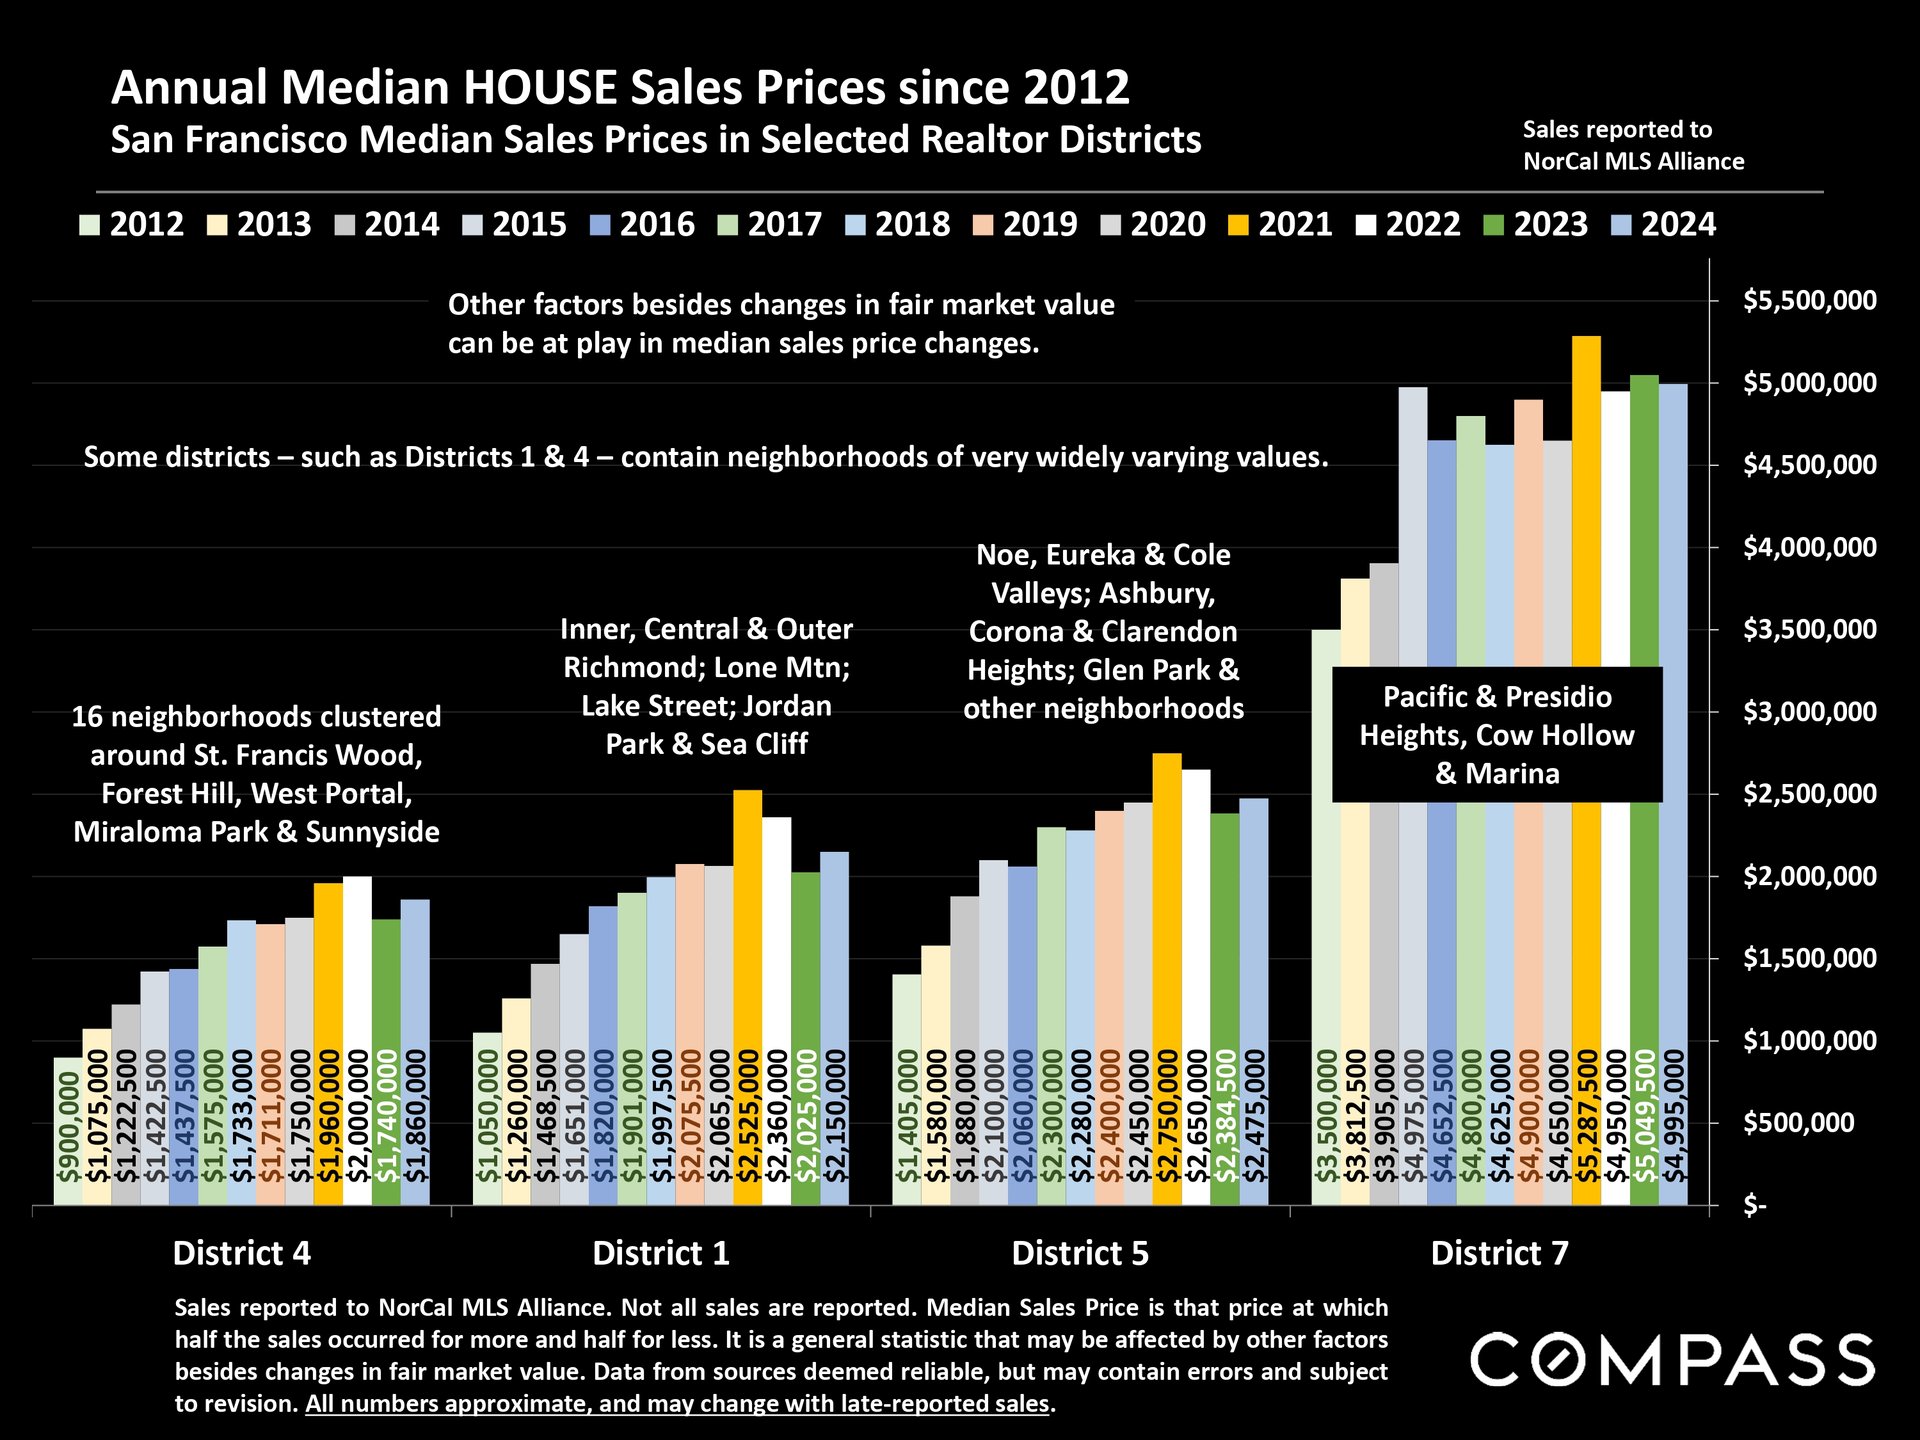
Chart comparing San Francisco median home sale prices from 2012 to 2024 across four realtor districts.


Bar chart comparing annual median home sale prices in San Francisco Districts 1, 4, 5, and 7 from 2012 to 2024.

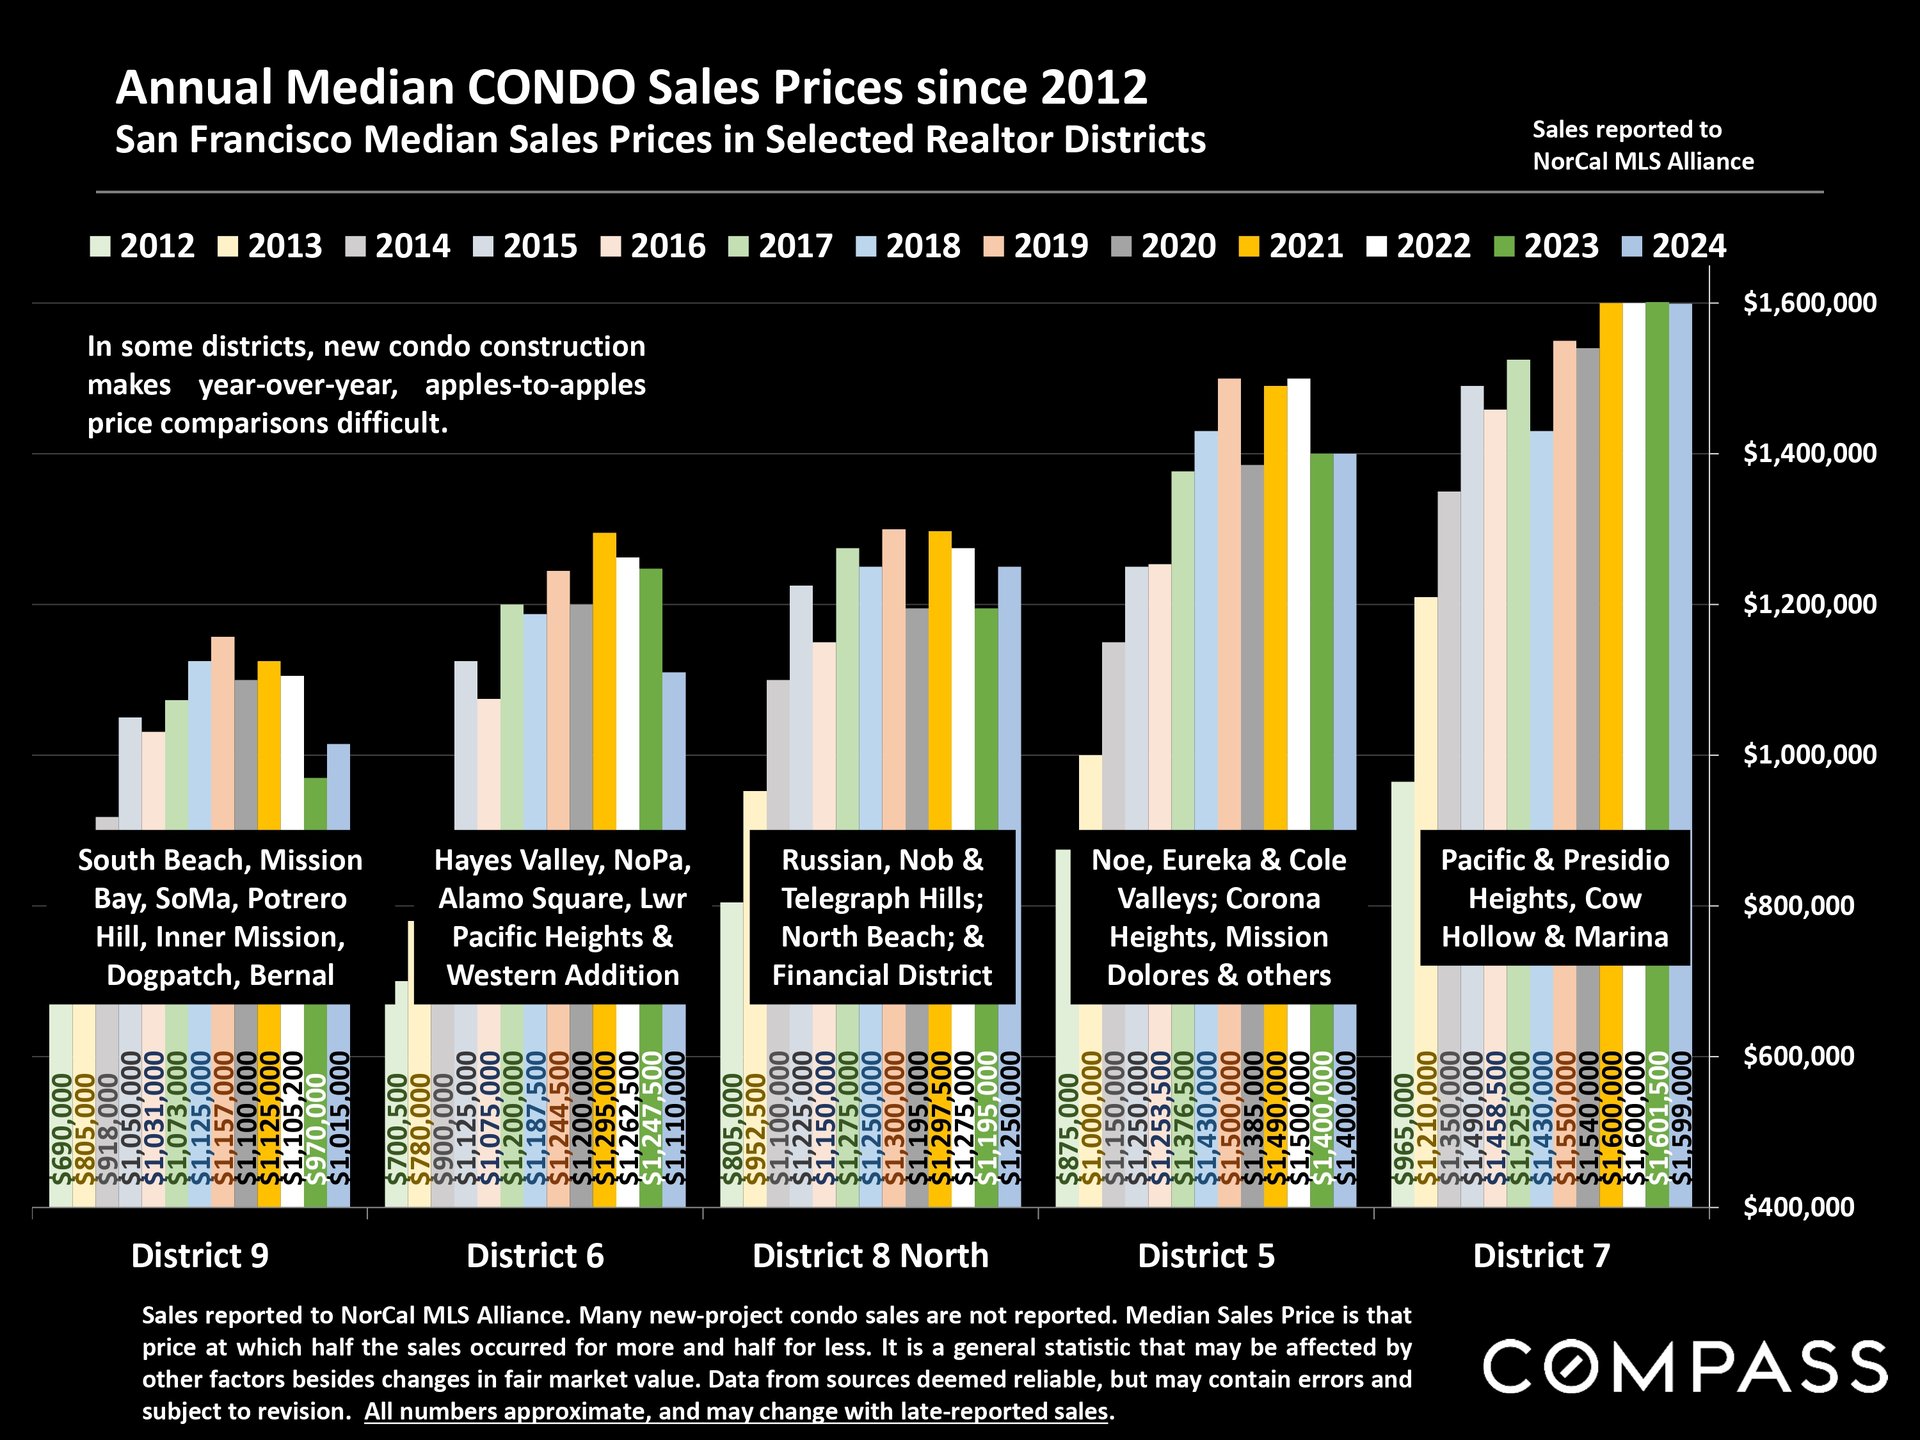
Chart of annual median condo sales prices from 2012 to 2024 across five San Francisco districts.


The statistics in this report represent the current market trends in your community. Curious how these trends will affect your home's value? Contact me today at 415.302.9052, [email protected].
Selling A Home?

Curious what the value of your home is in today's market?

Buying A Home?

Browse our exclusive properties in the area.

Work With Us

Beverly prides herself in making each client feel as if they’re her only client. She is supported by a full-time associate, transaction coordinator, and an incredible marketing team, leaving no part of her business unaccounted for.

Follow Us on Instagram